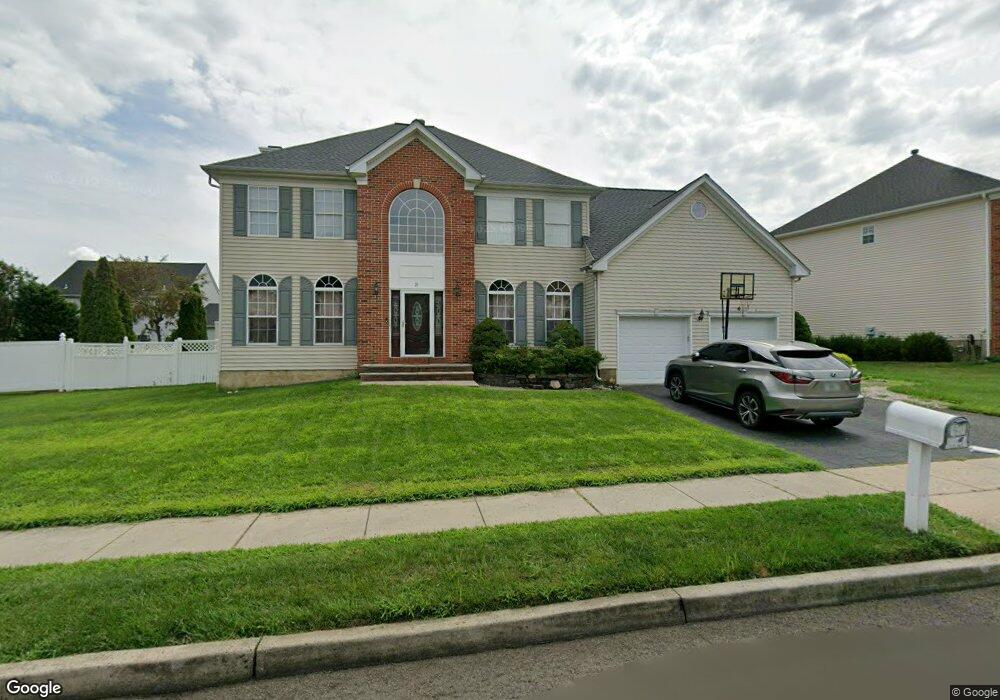
21 Redwick Way South River, NJ 08882
Estimated Value: $860,000 - $948,000
5
Beds
3
Baths
2,683
Sq Ft
$339/Sq Ft
Est. Value
About This Home
This home is located at 21 Redwick Way, South River, NJ 08882 and is currently estimated at $910,477, approximately $339 per square foot. 21 Redwick Way is a home located in Middlesex County with nearby schools including South River Primary School, South River Elementary School, and South River Middle School.
Ownership History
Date
Name
Owned For
Owner Type
Purchase Details
Closed on
Jan 17, 2002
Sold by
Rogers Donald
Bought by
Frenk Alexander and Frenk Yelena
Current Estimated Value
Home Financials for this Owner
Home Financials are based on the most recent Mortgage that was taken out on this home.
Original Mortgage
$300,000
Outstanding Balance
$119,488
Interest Rate
7.13%
Estimated Equity
$790,989
Purchase Details
Closed on
Nov 22, 1999
Sold by
Pdc Communities
Bought by
Rogers Donald and Rogers Lee Ann
Home Financials for this Owner
Home Financials are based on the most recent Mortgage that was taken out on this home.
Original Mortgage
$25,490
Interest Rate
7.98%
Create a Home Valuation Report for This Property
The Home Valuation Report is an in-depth analysis detailing your home's value as well as a comparison with similar homes in the area
Home Values in the Area
Average Home Value in this Area
Purchase History
| Date | Buyer | Sale Price | Title Company |
|---|---|---|---|
| Frenk Alexander | $378,000 | -- | |
| Rogers Donald | $254,900 | -- |
Source: Public Records
Mortgage History
| Date | Status | Borrower | Loan Amount |
|---|---|---|---|
| Open | Frenk Alexander | $300,000 | |
| Previous Owner | Rogers Donald | $25,490 |
Source: Public Records
Tax History
| Year | Tax Paid | Tax Assessment Tax Assessment Total Assessment is a certain percentage of the fair market value that is determined by local assessors to be the total taxable value of land and additions on the property. | Land | Improvement |
|---|---|---|---|---|
| 2025 | $14,169 | $556,300 | $180,500 | $375,800 |
| 2024 | $13,746 | $556,300 | $180,500 | $375,800 |
| 2023 | $13,746 | $556,300 | $180,500 | $375,800 |
| 2022 | $13,507 | $556,300 | $180,500 | $375,800 |
| 2021 | $9,681 | $556,300 | $180,500 | $375,800 |
| 2020 | $12,723 | $556,300 | $180,500 | $375,800 |
| 2019 | $13,385 | $162,500 | $30,000 | $132,500 |
| 2018 | $13,063 | $162,500 | $30,000 | $132,500 |
| 2017 | $12,586 | $162,500 | $30,000 | $132,500 |
| 2016 | $12,110 | $162,500 | $30,000 | $132,500 |
| 2015 | $11,838 | $162,500 | $30,000 | $132,500 |
| 2014 | $11,567 | $162,500 | $30,000 | $132,500 |
Source: Public Records
Map
Nearby Homes
Your Personal Tour Guide
Ask me questions while you tour the home.