21 Renaud St Fall River, MA 02721
Maplewood NeighborhoodEstimated Value: $443,000 - $540,000
About This Home
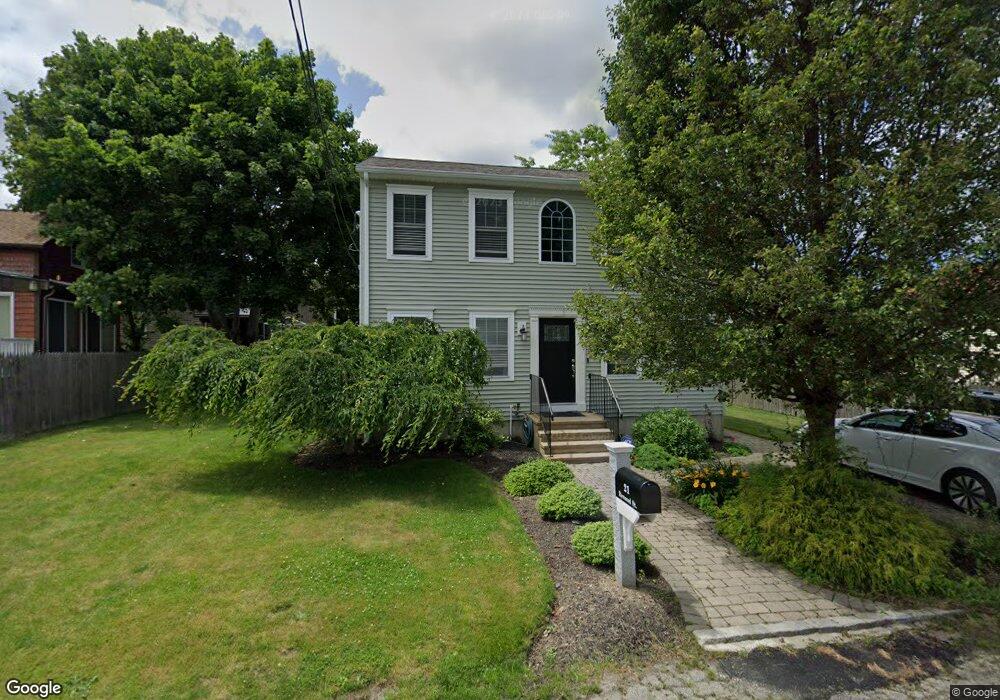
This home is located at 21 Renaud St, Fall River, MA 02721 and is currently estimated at $469,549, approximately $235 per square foot. 21 Renaud St is a home located in Bristol County with nearby schools including Letourneau Elementary School, Talbot Innovation School, and B M C Durfee High School.
Ownership History
We collect this data history from publicly available records. To have your information removed, we recommend requesting removal directly through your county’s website.
Purchase Details
Home Financials for this Owner
Home Financials are based on the most recent Mortgage that was taken out on this home.Home Values in the Area
Average Home Value in this Area
Purchase History
We collect this data history from publicly available records. To have your information removed, we recommend requesting removal directly through your county’s website.
| Date | Buyer | Sale Price | Title Company |
|---|---|---|---|
| $192,600 | -- |
Mortgage History
We collect this data history from publicly available records. To have your information removed, we recommend requesting removal directly through your county’s website.
| Date | Status | Borrower | Loan Amount |
|---|---|---|---|
| Open | $200,000 | ||
| Closed | $188,790 |
Tax History
We collect this data history from publicly available records. To have your information removed, we recommend requesting removal directly through your county’s website.
| Year | Tax Paid | Tax Assessment Tax Assessment Total Assessment is a certain percentage of the fair market value that is determined by local assessors to be the total taxable value of land and additions on the property. | Land | Improvement |
|---|---|---|---|---|
| 2025 | $4,016 | $350,700 | $115,500 | $235,200 |
| 2024 | $3,649 | $317,600 | $113,200 | $204,400 |
| 2023 | $3,757 | $306,200 | $102,000 | $204,200 |
| 2022 | $3,196 | $265,400 | $96,200 | $169,200 |
| 2021 | $3,196 | $231,100 | $91,900 | $139,200 |
| 2020 | $3,149 | $217,900 | $87,700 | $130,200 |
| 2019 | $3,158 | $216,600 | $91,700 | $124,900 |
| 2018 | $3,066 | $209,700 | $92,400 | $117,300 |
| 2017 | $2,906 | $207,600 | $92,400 | $115,200 |
| 2016 | $2,772 | $203,400 | $95,200 | $108,200 |
| 2015 | $2,799 | $214,000 | $95,200 | $118,800 |
| 2014 | $2,692 | $214,000 | $95,200 | $118,800 |
Map
- 69 Denver St
- 49 Denver St
- 239 Glasgow St Unit 10
- 449 Chicago St
- 548 Jefferson St
- 249 Baird St
- 97 Stevens St
- 262 Stevens St Unit 262
- 19 Abington Ln
- 248 Jefferson St
- 40 Winchester Ln Unit 33
- 1350 Rodman St
- 833 Grinnell St
- 147 Jefferson St
- 883 Grinnell St
- 889 Grinnell St Unit 2
- 540 Stevens St
- 649 Stafford Rd
- 26 Stockton St
- 150 Baker St
Ask me questions while you tour the home.