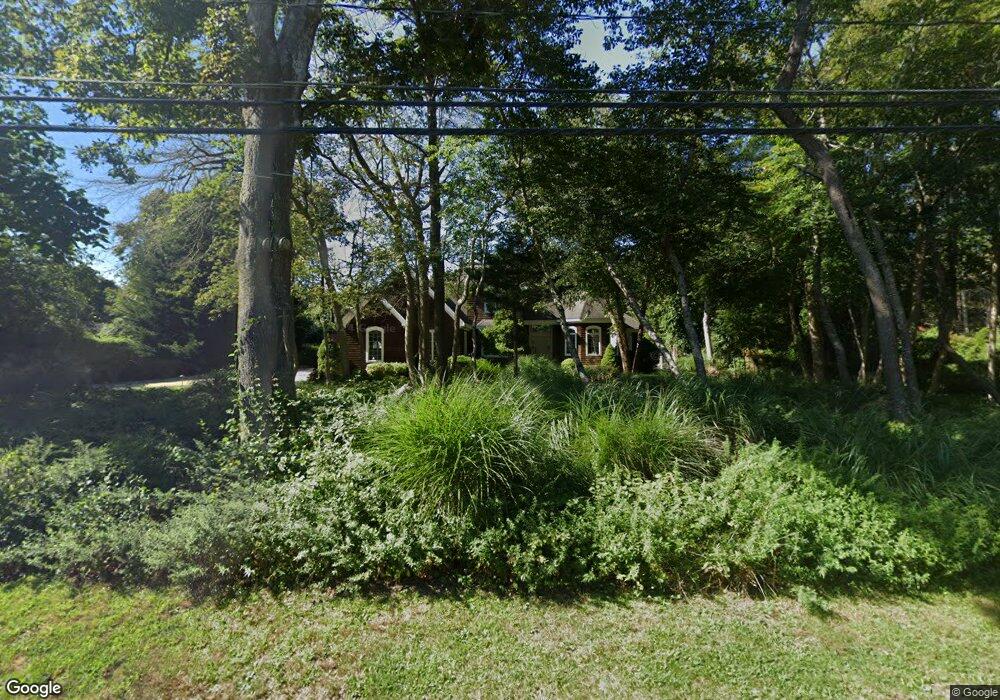
21 Seely Ln Sag Harbor, NY 11963
Estimated Value: $3,809,000 - $4,317,000
4
Beds
--
Bath
3,771
Sq Ft
$1,062/Sq Ft
Est. Value
About This Home
This home is located at 21 Seely Ln, Sag Harbor, NY 11963 and is currently estimated at $4,004,246, approximately $1,061 per square foot. 21 Seely Ln is a home located in Suffolk County with nearby schools including Sag Harbor Elementary School and Pierson Middle/High School.
Ownership History
Date
Name
Owned For
Owner Type
Purchase Details
Closed on
Sep 18, 2013
Sold by
Luhrs Britta
Bought by
Kelsey Jeffrey A and Kelsey Suzanne
Current Estimated Value
Home Financials for this Owner
Home Financials are based on the most recent Mortgage that was taken out on this home.
Original Mortgage
$1,000,000
Outstanding Balance
$735,609
Interest Rate
4.58%
Mortgage Type
New Conventional
Estimated Equity
$3,268,637
Purchase Details
Closed on
Jan 14, 2002
Sold by
Marino Carl and Reiner David
Bought by
Azevedo Frederico
Create a Home Valuation Report for This Property
The Home Valuation Report is an in-depth analysis detailing your home's value as well as a comparison with similar homes in the area
Home Values in the Area
Average Home Value in this Area
Purchase History
| Date | Buyer | Sale Price | Title Company |
|---|---|---|---|
| Kelsey Jeffrey A | $1,842,105 | -- | |
| Azevedo Frederico | $257,500 | First American Title Ins Co |
Source: Public Records
Mortgage History
| Date | Status | Borrower | Loan Amount |
|---|---|---|---|
| Open | Kelsey Jeffrey A | $1,000,000 |
Source: Public Records
Tax History
| Year | Tax Paid | Tax Assessment Tax Assessment Total Assessment is a certain percentage of the fair market value that is determined by local assessors to be the total taxable value of land and additions on the property. | Land | Improvement |
|---|---|---|---|---|
| 2024 | $2,144 | $1,940,500 | $756,000 | $1,184,500 |
| 2023 | $12,579 | $1,940,500 | $756,000 | $1,184,500 |
| 2022 | $11,361 | $1,883,400 | $756,000 | $1,127,400 |
| 2021 | $11,361 | $1,883,400 | $756,000 | $1,127,400 |
| 2020 | $12,166 | $1,883,400 | $756,000 | $1,127,400 |
| 2019 | $12,000 | $0 | $0 | $0 |
| 2018 | -- | $1,795,600 | $756,000 | $1,039,600 |
| 2017 | $11,133 | $1,795,600 | $756,000 | $1,039,600 |
| 2016 | $11,100 | $1,726,900 | $687,300 | $1,039,600 |
| 2015 | -- | $1,726,900 | $687,300 | $1,039,600 |
| 2014 | -- | $1,331,600 | $584,200 | $747,400 |
Source: Public Records
Map
Nearby Homes
Your Personal Tour Guide
Ask me questions while you tour the home.