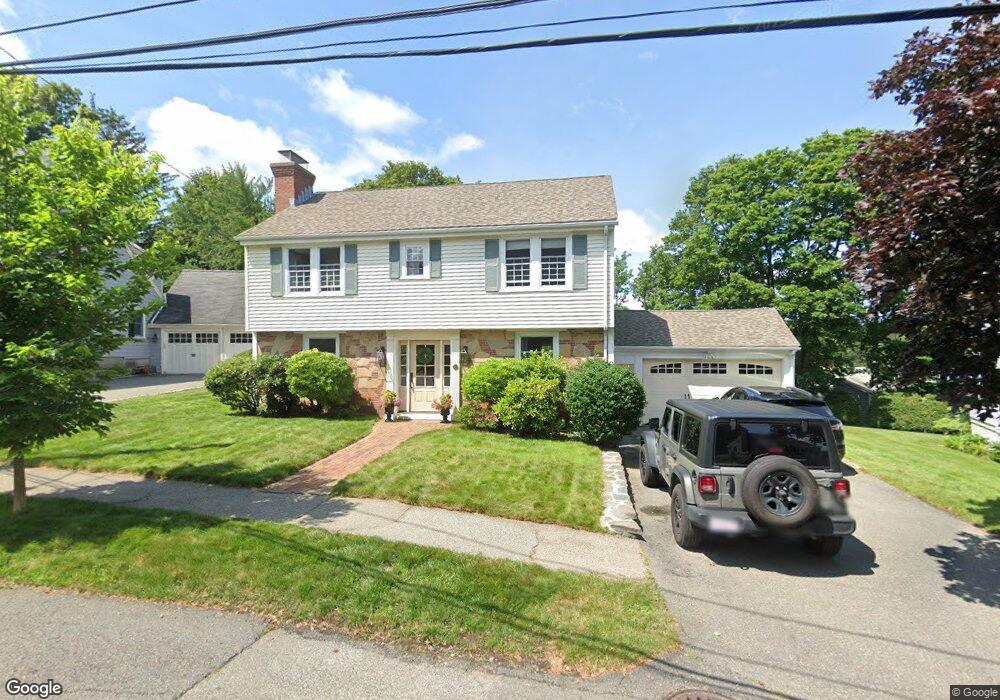
21 Sheridan Dr Milton, MA 02186
Milton Hill NeighborhoodEstimated Value: $1,234,000 - $1,319,000
4
Beds
2
Baths
1,986
Sq Ft
$643/Sq Ft
Est. Value
About This Home
This home is located at 21 Sheridan Dr, Milton, MA 02186 and is currently estimated at $1,277,316, approximately $643 per square foot. 21 Sheridan Dr is a home located in Norfolk County with nearby schools including Milton High School, St. Agatha School, and Milton Academy.
Ownership History
Date
Name
Owned For
Owner Type
Purchase Details
Closed on
Aug 28, 2003
Sold by
Oatway Andrew C and Oatway Catherine
Bought by
Sullivan Mark V and Sullivan Patricia A
Current Estimated Value
Home Financials for this Owner
Home Financials are based on the most recent Mortgage that was taken out on this home.
Original Mortgage
$498,000
Outstanding Balance
$222,249
Interest Rate
5.69%
Mortgage Type
Purchase Money Mortgage
Estimated Equity
$1,055,067
Purchase Details
Closed on
Sep 7, 2000
Sold by
Dragon Edmond L and Dragon Barbara J
Bought by
Oatway Andrew C and Oatway Catherine L
Home Financials for this Owner
Home Financials are based on the most recent Mortgage that was taken out on this home.
Original Mortgage
$272,000
Interest Rate
8.1%
Mortgage Type
Purchase Money Mortgage
Purchase Details
Closed on
Aug 30, 1996
Sold by
Spinelli Edith A
Bought by
Dragon Edmond L
Create a Home Valuation Report for This Property
The Home Valuation Report is an in-depth analysis detailing your home's value as well as a comparison with similar homes in the area
Home Values in the Area
Average Home Value in this Area
Purchase History
We collect this data history from publicly available records. To have your information removed, we recommend requesting removal directly through your county’s website.
| Date | Buyer | Sale Price | Title Company |
|---|---|---|---|
| Sullivan Mark V | $586,000 | -- | |
| Oatway Andrew C | $417,500 | -- | |
| Dragon Edmond L | $235,000 | -- |
Source: Public Records
Mortgage History
We collect this data history from publicly available records. To have your information removed, we recommend requesting removal directly through your county’s website.
| Date | Status | Borrower | Loan Amount |
|---|---|---|---|
| Open | Dragon Edmond L | $498,000 | |
| Previous Owner | Dragon Edmond L | $272,000 | |
| Previous Owner | Dragon Edmond L | $272,000 |
Source: Public Records
Tax History
| Year | Tax Paid | Tax Assessment Tax Assessment Total Assessment is a certain percentage of the fair market value that is determined by local assessors to be the total taxable value of land and additions on the property. | Land | Improvement |
|---|---|---|---|---|
| 2025 | $12,064 | $1,087,800 | $515,800 | $572,000 |
| 2024 | $11,610 | $1,063,200 | $491,200 | $572,000 |
| 2023 | $11,235 | $985,500 | $467,900 | $517,600 |
| 2022 | $10,855 | $870,500 | $467,900 | $402,600 |
| 2021 | $10,471 | $797,500 | $414,100 | $383,400 |
| 2020 | $10,262 | $782,200 | $406,300 | $375,900 |
| 2019 | $10,010 | $759,500 | $394,500 | $365,000 |
| 2018 | $9,859 | $713,900 | $356,200 | $357,700 |
| 2017 | $9,229 | $680,600 | $339,200 | $341,400 |
| 2016 | $8,516 | $630,800 | $296,800 | $334,000 |
| 2015 | $8,396 | $602,300 | $275,600 | $326,700 |
Source: Public Records
Map
Nearby Homes
- 12 Vinewood Rd
- 94 Grafton Ave
- 440 Granite Ave Unit 201
- 186 Granite Ave
- 141 Gardiner Rd
- 85 Forbes Rd
- 41 Wallace Rd
- 580 Quarry St Unit 18
- 30 Elmwood Park
- 97 Cliff St
- 213 School St
- 98 Pleasant St
- 33 Bishop Rd Unit 33
- 403405 Reedsdale Rd
- 169 Pine St
- 88 Wharf St Unit 607
- 88 Wharf St Unit 604
- 147 Canton Ave
- 134 Sherman St
- 75 Canton Ave
- 25 Sheridan Dr
- 15 Sheridan Dr
- 575 Pleasant St
- 579 Pleasant St
- 569 Pleasant St
- 6 Westvale Rd
- 583 Pleasant St
- 29 Sheridan Dr
- 24 Sheridan Dr
- 11 Sheridan Dr
- 10 Westvale Rd
- 16 Sheridan Dr
- 589 Pleasant St
- 30 Sheridan Dr
- 16 Westvale Rd
- 37 Sheridan Dr
- 7 Sheridan Dr
- 595 Pleasant St
- 578 Pleasant St
- 580 Pleasant St
Your Personal Tour Guide
Ask me questions while you tour the home.