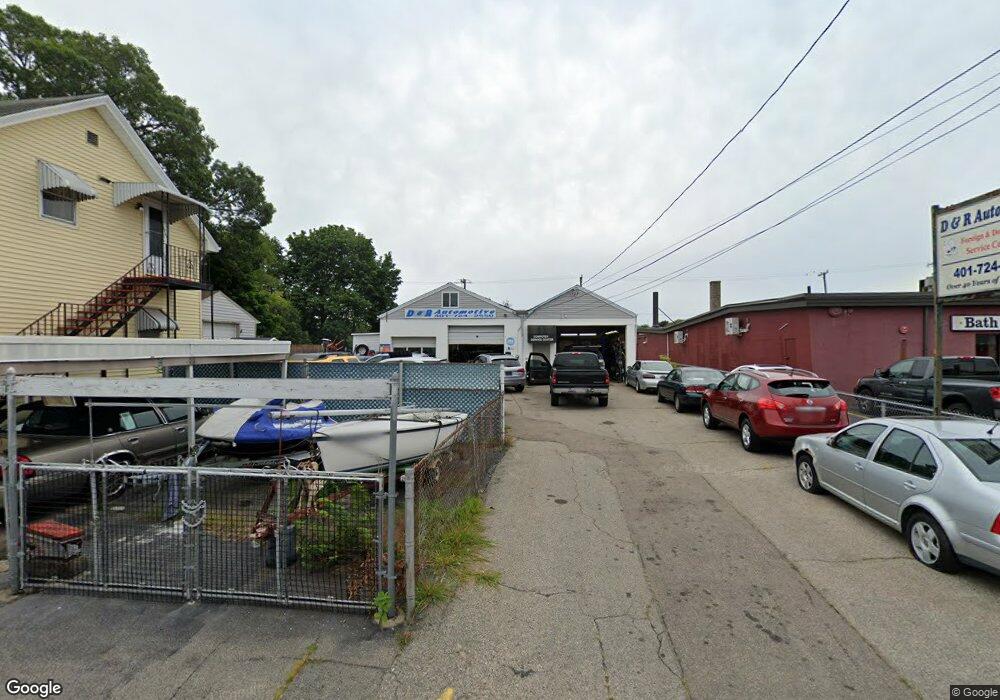
21 Slade St Pawtucket, RI 02861
Darlington NeighborhoodEstimated Value: $329,991
Studio
--
Bath
1,696
Sq Ft
$195/Sq Ft
Est. Value
About This Home
This home is located at 21 Slade St, Pawtucket, RI 02861 and is currently estimated at $329,991, approximately $194 per square foot. 21 Slade St is a home located in Providence County with nearby schools including St Cecilia School and Dayspring Christian Academy.
Ownership History
Date
Name
Owned For
Owner Type
Purchase Details
Closed on
Jun 3, 2004
Sold by
Belanger Lucien
Bought by
Automotives D and Automotives R
Current Estimated Value
Home Financials for this Owner
Home Financials are based on the most recent Mortgage that was taken out on this home.
Original Mortgage
$136,000
Outstanding Balance
$65,247
Interest Rate
5.94%
Mortgage Type
Commercial
Estimated Equity
$264,744
Create a Home Valuation Report for This Property
The Home Valuation Report is an in-depth analysis detailing your home's value as well as a comparison with similar homes in the area
Home Values in the Area
Average Home Value in this Area
Purchase History
We collect this data history from publicly available records. To have your information removed, we recommend requesting removal directly through your county’s website.
| Date | Buyer | Sale Price | Title Company |
|---|---|---|---|
| Automotives D | $170,000 | -- | |
| D & R Automotives Llc | $170,000 | -- |
Source: Public Records
Mortgage History
We collect this data history from publicly available records. To have your information removed, we recommend requesting removal directly through your county’s website.
| Date | Status | Borrower | Loan Amount |
|---|---|---|---|
| Open | D & R Automotives Llc | $136,000 | |
| Closed | D & R Automotives Llc | $136,000 |
Source: Public Records
Map
Nearby Homes
Your Personal Tour Guide
Ask me questions while you tour the home.