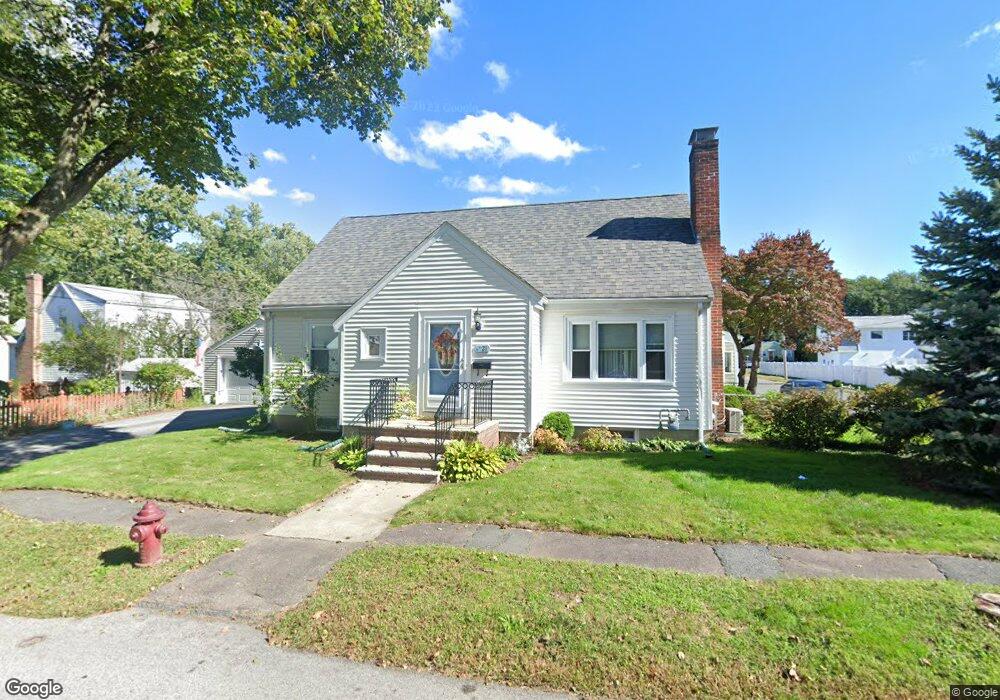
21 Tuttle St Saugus, MA 01906
Pleasant Hills NeighborhoodEstimated Value: $660,000 - $688,000
3
Beds
2
Baths
1,484
Sq Ft
$456/Sq Ft
Est. Value
About This Home
This home is located at 21 Tuttle St, Saugus, MA 01906 and is currently estimated at $676,331, approximately $455 per square foot. 21 Tuttle St is a home located in Essex County with nearby schools including Saugus High School, Pioneer Charter School of Science, and Pioneer Charter School Of Science II.
Ownership History
Date
Name
Owned For
Owner Type
Purchase Details
Closed on
Sep 27, 2021
Sold by
Woodworth Sandra J
Bought by
Woodworth Ft
Current Estimated Value
Purchase Details
Closed on
Mar 1, 2005
Sold by
Silver Mary
Bought by
Woodworth Sandra J
Create a Home Valuation Report for This Property
The Home Valuation Report is an in-depth analysis detailing your home's value as well as a comparison with similar homes in the area
Home Values in the Area
Average Home Value in this Area
Purchase History
We collect this data history from publicly available records. To have your information removed, we recommend requesting removal directly through your county’s website.
| Date | Buyer | Sale Price | Title Company |
|---|---|---|---|
| Woodworth Ft | -- | None Available | |
| Woodworth Sandra J | $335,000 | -- |
Source: Public Records
Mortgage History
We collect this data history from publicly available records. To have your information removed, we recommend requesting removal directly through your county’s website.
| Date | Status | Borrower | Loan Amount |
|---|---|---|---|
| Previous Owner | Woodworth Sandra J | $168,000 | |
| Previous Owner | Woodworth Sandra J | $190,309 | |
| Previous Owner | Woodworth Sandra J | $214,000 |
Source: Public Records
Tax History
| Year | Tax Paid | Tax Assessment Tax Assessment Total Assessment is a certain percentage of the fair market value that is determined by local assessors to be the total taxable value of land and additions on the property. | Land | Improvement |
|---|---|---|---|---|
| 2025 | $6,127 | $573,700 | $300,500 | $273,200 |
| 2024 | $5,882 | $552,300 | $283,300 | $269,000 |
| 2023 | $5,725 | $508,400 | $249,000 | $259,400 |
| 2022 | $5,593 | $465,700 | $228,400 | $237,300 |
| 2021 | $5,274 | $427,400 | $198,300 | $229,100 |
| 2020 | $4,881 | $409,500 | $188,900 | $220,600 |
| 2019 | $4,703 | $386,100 | $171,700 | $214,400 |
| 2018 | $4,229 | $365,200 | $166,500 | $198,700 |
| 2017 | $3,914 | $324,800 | $155,400 | $169,400 |
| 2016 | $3,390 | $277,900 | $155,100 | $122,800 |
| 2015 | $3,180 | $264,600 | $147,700 | $116,900 |
| 2014 | $3,266 | $281,300 | $147,700 | $133,600 |
Source: Public Records
Map
Nearby Homes
Your Personal Tour Guide
Ask me questions while you tour the home.