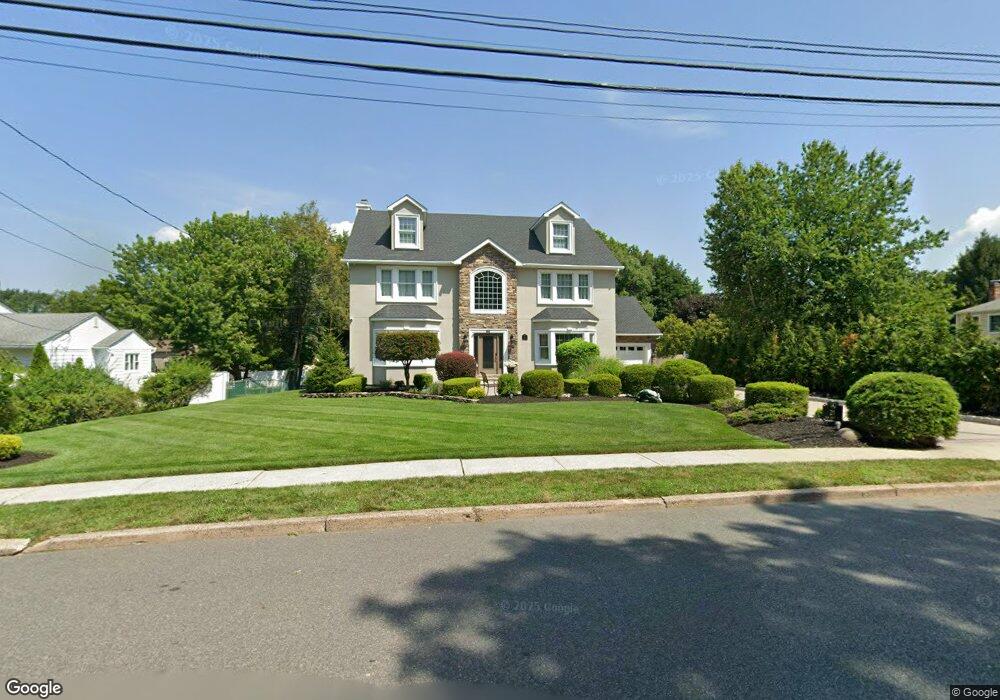
21 Van Dyke Rd Waldwick, NJ 07463
Estimated Value: $800,000 - $1,237,445
Studio
--
Bath
3,276
Sq Ft
$323/Sq Ft
Est. Value
About This Home
This home is located at 21 Van Dyke Rd, Waldwick, NJ 07463 and is currently estimated at $1,059,361, approximately $323 per square foot. 21 Van Dyke Rd is a home located in Bergen County with nearby schools including Waldwick High School, The Village School - Montessori, and Waldwick Seventh-Day Adventist School.
Ownership History
Date
Name
Owned For
Owner Type
Purchase Details
Closed on
Apr 20, 2004
Sold by
Prudential Relocation Inc
Bought by
Ayala Anthony and Ayala Margaret
Current Estimated Value
Home Financials for this Owner
Home Financials are based on the most recent Mortgage that was taken out on this home.
Original Mortgage
$321,750
Outstanding Balance
$152,361
Interest Rate
5.75%
Estimated Equity
$907,000
Purchase Details
Closed on
Jan 15, 2004
Sold by
Cherichella Maria
Bought by
Prudential Relocation Inc
Create a Home Valuation Report for This Property
The Home Valuation Report is an in-depth analysis detailing your home's value as well as a comparison with similar homes in the area
Home Values in the Area
Average Home Value in this Area
Purchase History
We collect this data history from publicly available records. To have your information removed, we recommend requesting removal directly through your county’s website.
| Date | Buyer | Sale Price | Title Company |
|---|---|---|---|
| Ayala Anthony | $429,000 | -- | |
| Prudential Relocation Inc | $429,000 | -- |
Source: Public Records
Mortgage History
We collect this data history from publicly available records. To have your information removed, we recommend requesting removal directly through your county’s website.
| Date | Status | Borrower | Loan Amount |
|---|---|---|---|
| Open | Ayala Anthony | $321,750 |
Source: Public Records
Tax History
| Year | Tax Paid | Tax Assessment Tax Assessment Total Assessment is a certain percentage of the fair market value that is determined by local assessors to be the total taxable value of land and additions on the property. | Land | Improvement |
|---|---|---|---|---|
| 2025 | $21,879 | $988,200 | $397,400 | $590,800 |
| 2024 | $22,389 | $988,200 | $397,400 | $590,800 |
| 2023 | $21,927 | $769,900 | $340,000 | $429,900 |
| 2022 | $21,927 | $769,900 | $340,000 | $429,900 |
| 2021 | $21,511 | $769,900 | $340,000 | $429,900 |
| 2020 | $21,303 | $769,900 | $340,000 | $429,900 |
| 2019 | $21,295 | $769,900 | $340,000 | $429,900 |
| 2018 | $20,626 | $769,900 | $340,000 | $429,900 |
| 2017 | $20,449 | $769,900 | $340,000 | $429,900 |
| 2016 | $20,033 | $769,900 | $340,000 | $429,900 |
| 2015 | $19,802 | $769,900 | $340,000 | $429,900 |
| 2014 | $19,324 | $769,900 | $340,000 | $429,900 |
Source: Public Records
Map
Nearby Homes
- 22-1 Tamaron Dr
- 114 Crescent Ave
- 16 Wilson Terrace
- 46 van Blarcom Ln
- 74 van Blarcom Ln
- 4 Lee Ct
- 8 Edgewood Ave
- 29 Lindbergh Pkwy
- 63 Park Ave
- 31 Susan Ave
- 53 Smithfield Rd
- 112 Edgewood Rd
- 314 Meadowbrook Rd
- 70 Hummingbird Ct
- 34 Zimmer Ave
- 20 Cambridge Dr
- 80 W Prospect St
- 309 Windham Ct
- 1 Smith St
- 255 Park Ave
Your Personal Tour Guide
Ask me questions while you tour the home.