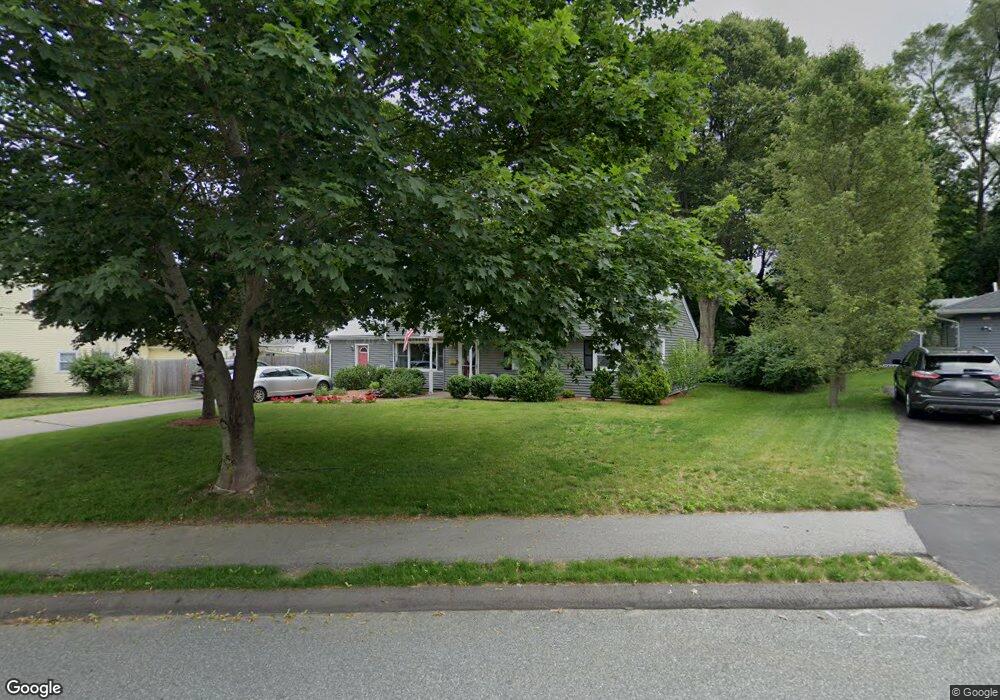
21 Waring Rd Natick, MA 01760
Estimated Value: $997,849 - $1,140,000
5
Beds
2
Baths
2,218
Sq Ft
$477/Sq Ft
Est. Value
About This Home
This home is located at 21 Waring Rd, Natick, MA 01760 and is currently estimated at $1,057,212, approximately $476 per square foot. 21 Waring Rd is a home located in Middlesex County with nearby schools including Natick High School, Bennett-Hemenway (Ben-Hem) Elementary School, and Wilson Middle School.
Ownership History
Date
Name
Owned For
Owner Type
Purchase Details
Closed on
Nov 13, 2023
Sold by
Nolan Edward L and Nolan Janet M
Bought by
21 Waring Road Rt and Nolan
Current Estimated Value
Purchase Details
Closed on
Apr 1, 1986
Bought by
Nolan Edward L and Morrison Janet L
Create a Home Valuation Report for This Property
The Home Valuation Report is an in-depth analysis detailing your home's value as well as a comparison with similar homes in the area
Home Values in the Area
Average Home Value in this Area
Purchase History
| Date | Buyer | Sale Price | Title Company |
|---|---|---|---|
| 21 Waring Road Rt | -- | None Available | |
| Nolan Edward L | $144,500 | -- |
Source: Public Records
Mortgage History
| Date | Status | Borrower | Loan Amount |
|---|---|---|---|
| Previous Owner | Nolan Edward L | $181,000 | |
| Previous Owner | Nolan Edward L | $106,000 | |
| Previous Owner | Nolan Edward L | $105,000 |
Source: Public Records
Tax History
| Year | Tax Paid | Tax Assessment Tax Assessment Total Assessment is a certain percentage of the fair market value that is determined by local assessors to be the total taxable value of land and additions on the property. | Land | Improvement |
|---|---|---|---|---|
| 2025 | $9,574 | $800,500 | $458,400 | $342,100 |
| 2024 | $9,297 | $758,300 | $433,000 | $325,300 |
| 2023 | $9,122 | $721,700 | $406,800 | $314,900 |
| 2022 | $8,894 | $666,700 | $370,500 | $296,200 |
| 2021 | $5,721 | $627,900 | $350,200 | $277,700 |
| 2020 | $5,461 | $612,700 | $335,000 | $277,700 |
| 2019 | $8,401 | $612,700 | $335,000 | $277,700 |
| 2018 | $7,940 | $608,400 | $304,500 | $303,900 |
| 2017 | $7,672 | $568,700 | $270,600 | $298,100 |
| 2016 | $7,474 | $550,800 | $255,600 | $295,200 |
| 2015 | $7,231 | $523,200 | $255,600 | $267,600 |
Source: Public Records
Map
Nearby Homes
Your Personal Tour Guide
Ask me questions while you tour the home.