210 E Morrell St Otsego, MI 49078
Estimated Value: $227,000 - $265,000
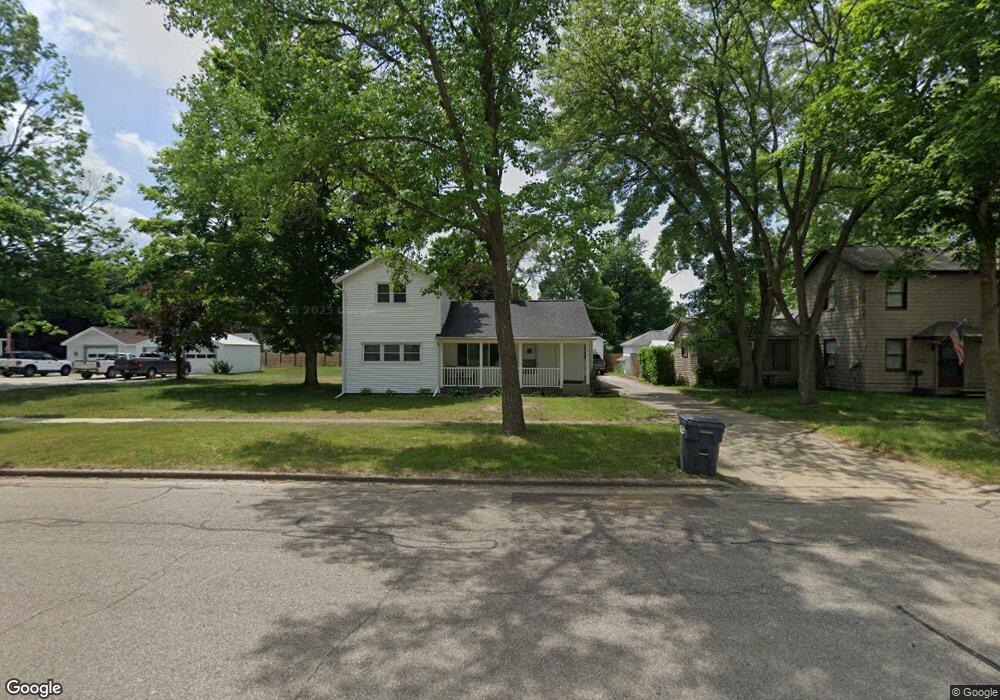
About This Home
This home is located at 210 E Morrell St, Otsego, MI 49078 and is currently estimated at $246,113, approximately $120 per square foot. 210 E Morrell St is a home located in Allegan County with nearby schools including Otsego High School, Otsego Christian Academy, and St. Margaret School.
Ownership History
We collect this data history from publicly available records. To have your information removed, we recommend requesting removal directly through your county’s website.
Purchase Details
Home Financials for this Owner
Home Financials are based on the most recent Mortgage that was taken out on this home.Purchase Details
Home Values in the Area
Average Home Value in this Area
Purchase History
We collect this data history from publicly available records. To have your information removed, we recommend requesting removal directly through your county’s website.
| Date | Buyer | Sale Price | Title Company |
|---|---|---|---|
| $94,900 | Devon Title Agency | ||
| $10,000 | Devon Title Agency |
Mortgage History
We collect this data history from publicly available records. To have your information removed, we recommend requesting removal directly through your county’s website.
| Date | Status | Borrower | Loan Amount |
|---|---|---|---|
| Open | $96,798 |
Tax History
We collect this data history from publicly available records. To have your information removed, we recommend requesting removal directly through your county’s website.
| Year | Tax Paid | Tax Assessment Tax Assessment Total Assessment is a certain percentage of the fair market value that is determined by local assessors to be the total taxable value of land and additions on the property. | Land | Improvement |
|---|---|---|---|---|
| 2026 | $2,453 | $125,100 | $11,200 | $113,900 |
| 2025 | $2,398 | $119,000 | $10,000 | $109,000 |
| 2024 | $2,054 | $107,000 | $6,000 | $101,000 |
| 2023 | $2,287 | $94,000 | $5,700 | $88,300 |
| 2022 | $2,054 | $83,300 | $5,700 | $77,600 |
| 2021 | $2,047 | $77,500 | $5,700 | $71,800 |
| 2020 | $2,018 | $78,000 | $5,700 | $72,300 |
| 2019 | $1,963 | $66,200 | $5,700 | $60,500 |
| 2018 | $1,913 | $60,700 | $5,700 | $55,000 |
| 2017 | $0 | $51,000 | $6,200 | $44,800 |
| 2016 | $0 | $47,700 | $4,500 | $43,200 |
| 2015 | -- | $47,700 | $4,500 | $43,200 |
| 2014 | $2,133 | $43,200 | $7,900 | $35,300 |
| 2013 | $2,133 | $41,400 | $6,500 | $34,900 |
Map
- 224 Charles St
- 212 E Allegan St
- 1431 Michigan 89
- 120 N Farmer St
- 216 N Wilmott St
- 117 Helen Ave
- 378 W Franklin St
- 612 Conference St
- 361 W Allegan St
- 430 W Franklin St
- 709 Brookside Dr
- 509 W Allegan St
- 206 S Grant St
- 1667 Prairiewood Ct Unit 1
- 0 Briarwood St Unit 25002251
- 1362 Michigan Unit 89-183
- 1753 106th Ave
- 1644 Aspen Trail
- 1667 Aspen Trail
- 1108 Barton St
- 204 E Morrell St
- 211 E Morrell St
- 411 S Fair St
- 323 S Fair St
- 126 E Morrell St
- 222 E Morrell St
- 222 E Morrell St
- 317 S Fair St
- 217 E Morrell St
- 412 S Fair St
- 116 E Morrell St
- 311 S Fair St
- 117 E Morrell St
- 215 E Hammond St
- 418 S Fair St
- 223 E Morrell St
- 309 S Fair St
- 219 E Hammond St
- 203 E Hammond St
- 230 E Morrell St
Ask me questions while you tour the home.