2103 Clay St Kannapolis, NC 28083
Estimated Value: $166,000 - $212,000
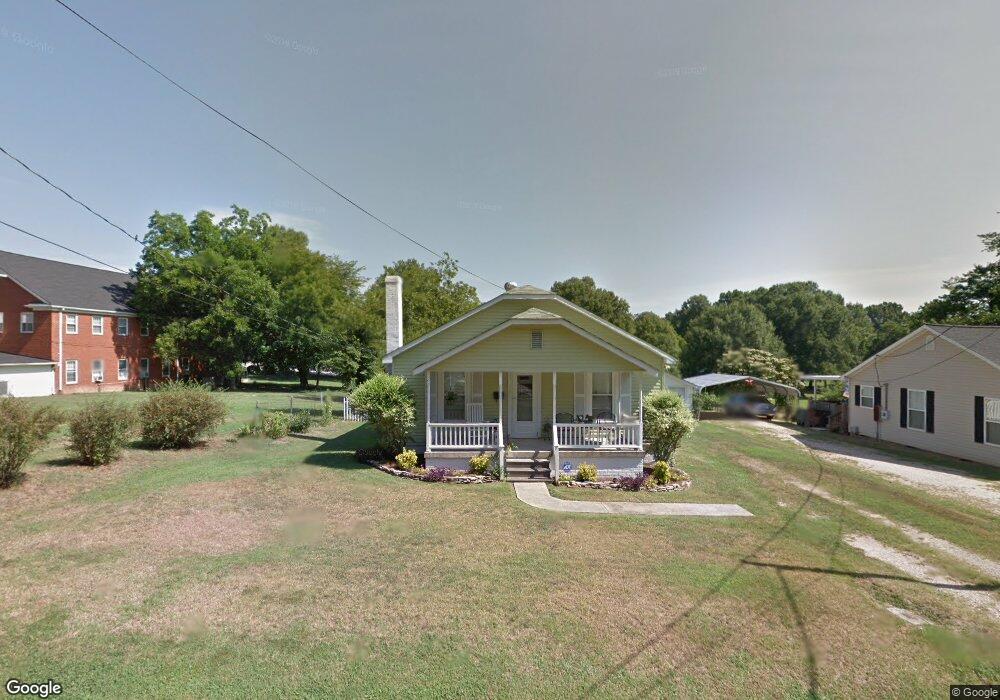
About This Home
This home is located at 2103 Clay St, Kannapolis, NC 28083 and is currently estimated at $192,779, approximately $229 per square foot. 2103 Clay St is a home located in Cabarrus County with nearby schools including Jackson Park Elementary School, Kannapolis Middle, and A.L. Brown High School.
Ownership History
We collect this data history from publicly available records. To have your information removed, we recommend requesting removal directly through your county’s website.
Purchase Details
Home Financials for this Owner
Home Financials are based on the most recent Mortgage that was taken out on this home.Purchase Details
Home Financials for this Owner
Home Financials are based on the most recent Mortgage that was taken out on this home.Home Values in the Area
Average Home Value in this Area
Purchase History
We collect this data history from publicly available records. To have your information removed, we recommend requesting removal directly through your county’s website.
| Date | Buyer | Sale Price | Title Company |
|---|---|---|---|
| $73,500 | -- | ||
| $50,000 | -- |
Mortgage History
We collect this data history from publicly available records. To have your information removed, we recommend requesting removal directly through your county’s website.
| Date | Status | Borrower | Loan Amount |
|---|---|---|---|
| Open | $58,800 | ||
| Previous Owner | $48,500 |
Tax History
We collect this data history from publicly available records. To have your information removed, we recommend requesting removal directly through your county’s website.
| Year | Tax Paid | Tax Assessment Tax Assessment Total Assessment is a certain percentage of the fair market value that is determined by local assessors to be the total taxable value of land and additions on the property. | Land | Improvement |
|---|---|---|---|---|
| 2025 | $1,774 | $156,220 | $65,000 | $91,220 |
| 2024 | $1,774 | $156,220 | $65,000 | $91,220 |
| 2023 | $1,050 | $76,650 | $29,300 | $47,350 |
| 2022 | $1,023 | $74,650 | $29,300 | $45,350 |
| 2021 | $1,023 | $74,650 | $29,300 | $45,350 |
| 2020 | $1,023 | $74,650 | $29,300 | $45,350 |
| 2019 | $992 | $72,410 | $20,520 | $51,890 |
| 2018 | $978 | $72,410 | $20,520 | $51,890 |
| 2017 | $963 | $72,410 | $20,520 | $51,890 |
| 2016 | $963 | $70,240 | $24,410 | $45,830 |
| 2015 | $885 | $70,240 | $24,410 | $45,830 |
| 2014 | $885 | $70,240 | $24,410 | $45,830 |
Map
- 2137 Lane St
- 504 Hunter Ave
- 523 Patterson Ave
- 2122 Englewood St
- 545 Collins St
- 2105 Woodlawn St
- 2171 Brantley Creek Dr
- 1911 Glenwood St
- 518 Annex Ave
- 2011 Samantha Dr
- 506 Nola Ave
- 2108 Moose Rd
- 2402 Brantley Rd
- 309 Oakdale Ave
- 2404 Brantley Rd
- 2369 Glenwood St
- 909 Evelyn Ave
- 1547 Tammy Ct
- 1500 Nectar Way Unit 32
- 912 Laura Ave
Ask me questions while you tour the home.