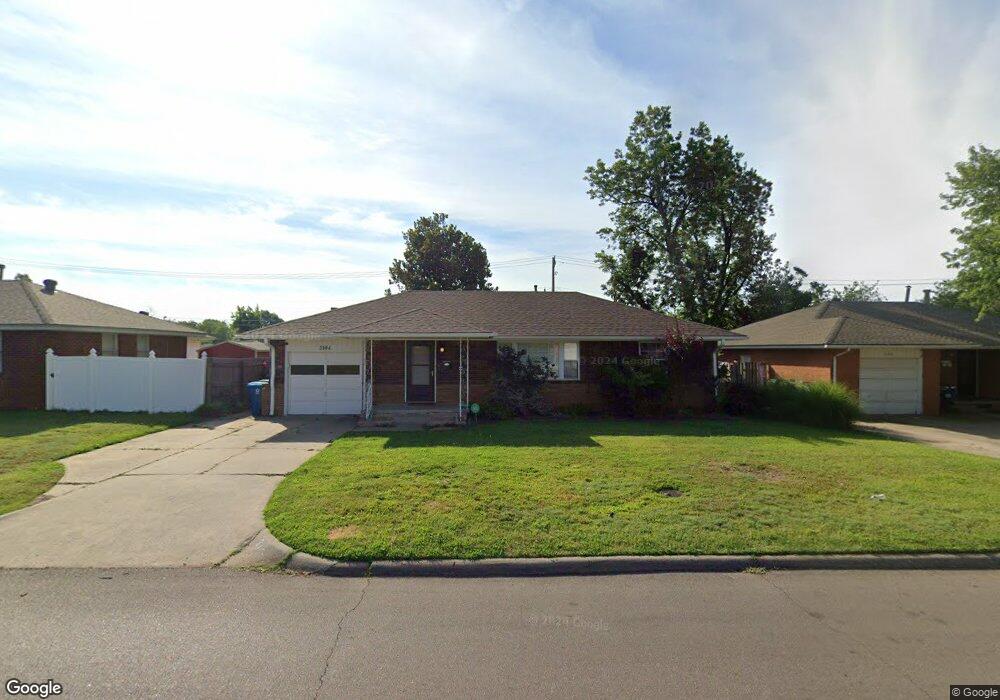
2104 Maple Dr Midwest City, OK 73110
Estimated Value: $129,586 - $196,000
2
Beds
1
Bath
1,053
Sq Ft
$146/Sq Ft
Est. Value
About This Home
This home is located at 2104 Maple Dr, Midwest City, OK 73110 and is currently estimated at $153,647, approximately $145 per square foot. 2104 Maple Dr is a home located in Oklahoma County with nearby schools including Country Estates Elementary School, Midwest City Middle School, and Midwest City High School.
Ownership History
Date
Name
Owned For
Owner Type
Purchase Details
Closed on
Nov 5, 2018
Sold by
Green Linda J
Bought by
Sam Rentals Llc
Current Estimated Value
Purchase Details
Closed on
Dec 12, 2001
Sold by
Ellis Sara Faye and Ellis J A
Bought by
Green Linda J
Home Financials for this Owner
Home Financials are based on the most recent Mortgage that was taken out on this home.
Original Mortgage
$53,795
Interest Rate
6.39%
Mortgage Type
FHA
Purchase Details
Closed on
Jan 16, 2000
Sold by
May Lois G
Bought by
May Lois G and Lois G May Trust
Create a Home Valuation Report for This Property
The Home Valuation Report is an in-depth analysis detailing your home's value as well as a comparison with similar homes in the area
Home Values in the Area
Average Home Value in this Area
Purchase History
| Date | Buyer | Sale Price | Title Company |
|---|---|---|---|
| Sam Rentals Llc | $60,500 | None Available | |
| Green Linda J | $27,000 | First Amer Title & Trust Co | |
| Green Linda J | $27,500 | First Amer Title & Trust Co | |
| May Lois G | -- | -- |
Source: Public Records
Mortgage History
| Date | Status | Borrower | Loan Amount |
|---|---|---|---|
| Previous Owner | Green Linda J | $53,795 |
Source: Public Records
Tax History
| Year | Tax Paid | Tax Assessment Tax Assessment Total Assessment is a certain percentage of the fair market value that is determined by local assessors to be the total taxable value of land and additions on the property. | Land | Improvement |
|---|---|---|---|---|
| 2025 | $1,237 | $10,598 | $2,278 | $8,320 |
| 2023 | $1,132 | $9,613 | $1,700 | $7,913 |
| 2022 | $1,068 | $9,156 | $1,795 | $7,361 |
| 2021 | $1,042 | $8,720 | $1,986 | $6,734 |
| 2020 | $1,020 | $8,305 | $2,091 | $6,214 |
| 2019 | $1,008 | $8,580 | $1,876 | $6,704 |
| 2018 | $450 | $5,081 | $0 | $0 |
| 2017 | $457 | $5,080 | $1,171 | $3,909 |
| 2016 | $469 | $5,080 | $1,195 | $3,885 |
| 2015 | $489 | $5,080 | $1,240 | $3,840 |
| 2014 | $488 | $5,080 | $1,233 | $3,847 |
Source: Public Records
Map
Nearby Homes
Your Personal Tour Guide
Ask me questions while you tour the home.