
Seller's Agent in 2025
Theresa Montoya
Vantage Point Brokers, LLC
(702) 787-4385
1 in this area
27 Total Sales
Estimated Value: $103,623 - $222,000
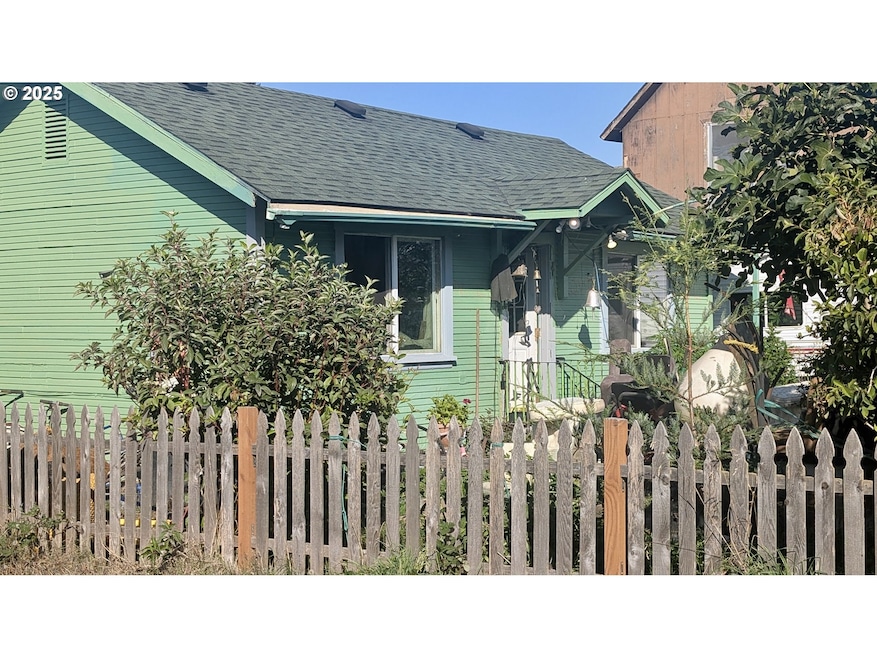
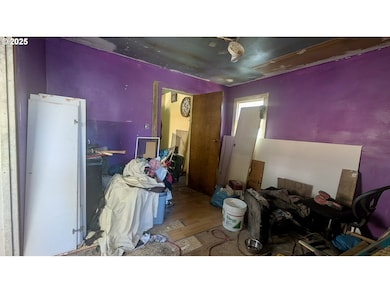
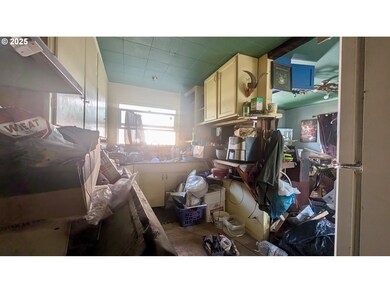
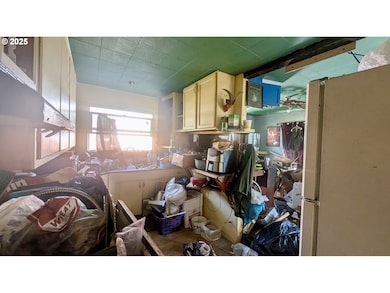
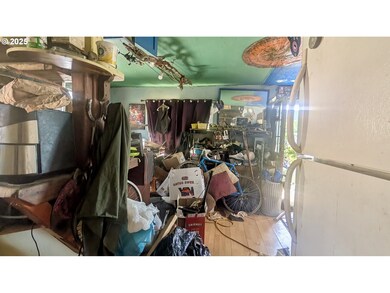
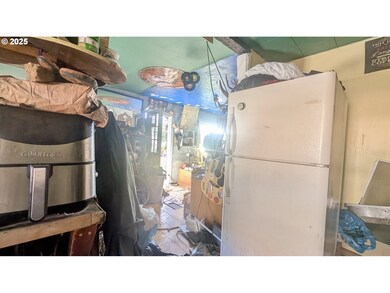
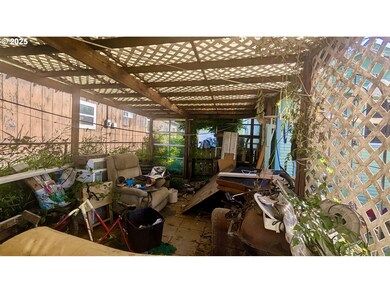
2-Bedroom Fixer with Tons of Potential – Great Investment Opportunity!This 2-bedroom, 1-bath home offers 720 sq ft of living space and is full of potential for the right buyer. Whether you're looking for your next renovation project, a rental property, or a starter home to make your own, this is a great opportunity to build equity.The layout offers a solid foundation with a functional floor plan. With some TLC and vision, this property could shine once again. Situated on a manageable lot in a convenient location, the possibilities are endless.Priced to sell – bring your tools and imagination!
Last Agent to Sell the Property
Vantage Point Brokers, LLC License #201254782 Listed on: 09/25/2025
Last Buyer's Agent
Vantage Point Brokers, LLC License #201254782 Listed on: 09/25/2025
We collect this data history from publicly available records. To have your information removed, we recommend requesting removal directly through your county’s website.
| Date | Buyer | Sale Price | Title Company |
|---|---|---|---|
| Hanna Jay | $94,000 | Lawyers Title | |
| Ferrell Joseph C | $15,000 | Amrock | |
| Ferrell Joseph C | -- | None Available |
We collect this data history from publicly available records. To have your information removed, we recommend requesting removal directly through your county’s website.
| Date | Status | Borrower | Loan Amount |
|---|---|---|---|
| Previous Owner | Ferrell Joseph C | $40,700 |
| Date | Event | Price | List to Sale | Price per Sq Ft |
|---|---|---|---|---|
| 11/20/2025 11/20/25 | Sold | $94,000 | -6.0% | $131 / Sq Ft |
| 10/10/2025 10/10/25 | Pending | -- | -- | -- |
| 09/25/2025 09/25/25 | For Sale | $100,000 | -- | $139 / Sq Ft |
| Year | Tax Paid | Tax Assessment Tax Assessment Total Assessment is a certain percentage of the fair market value that is determined by local assessors to be the total taxable value of land and additions on the property. | Land | Improvement |
|---|---|---|---|---|
| 2025 | $1,181 | $71,230 | -- | -- |
| 2024 | $1,161 | $69,160 | -- | -- |
| 2023 | $1,108 | $67,150 | $0 | $0 |
| 2022 | $1,090 | $65,200 | $0 | $0 |
| 2021 | $1,063 | $63,310 | $0 | $0 |
| 2020 | $1,033 | $63,310 | $0 | $0 |
| 2019 | $988 | $59,680 | $0 | $0 |
| 2018 | $952 | $57,950 | $0 | $0 |
| 2017 | $936 | $56,270 | $0 | $0 |
| 2016 | $896 | $54,640 | $0 | $0 |
| 2015 | $827 | $53,050 | $0 | $0 |
| 2014 | $827 | $51,510 | $0 | $0 |
Seller's Agent in 2025
Theresa Montoya
Vantage Point Brokers, LLC
(702) 787-4385
1 in this area
27 Total Sales
Source: Regional Multiple Listing Service (RMLS)
MLS Number: 127905576
APN: 1003455400
Disclaimer: Certain information contained herein is derived from information provided by parties other than Homes.com. All information provided is deemed reliable, but is not guaranteed to be accurate and should be independently verified.
![]() The content relating to real estate for sale on this web site comes in part from the IDX program of the RMLS™ of Portland, Oregon. Real estate listings held by brokerage firms other than Ten-X are marked with the RMLS™ logo, and detailed information about these properties includes the names of the listing brokers. Listing content is copyright © 2026 RMLS™, Portland, Oregon. Some properties which appear for sale on this web site may subsequently have sold or may no longer be available. All information provided is deemed reliable but is not guaranteed and should be independently verified.
The content relating to real estate for sale on this web site comes in part from the IDX program of the RMLS™ of Portland, Oregon. Real estate listings held by brokerage firms other than Ten-X are marked with the RMLS™ logo, and detailed information about these properties includes the names of the listing brokers. Listing content is copyright © 2026 RMLS™, Portland, Oregon. Some properties which appear for sale on this web site may subsequently have sold or may no longer be available. All information provided is deemed reliable but is not guaranteed and should be independently verified.
Ask me questions while you tour the home.