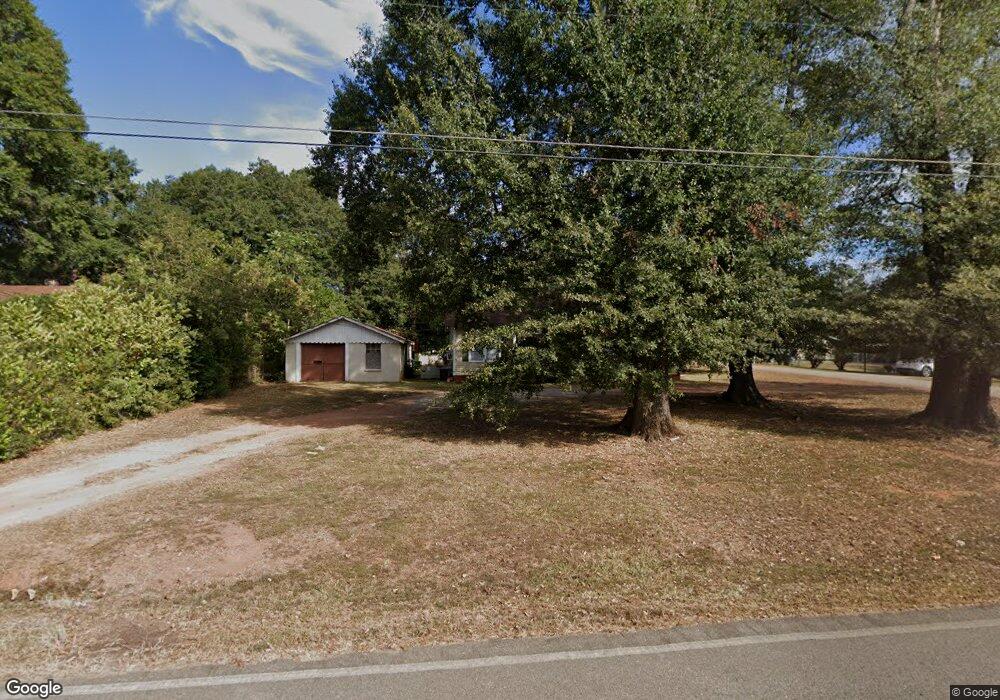
211 Dallas Dr Thomaston, GA 30286
Estimated Value: $115,000 - $163,000
2
Beds
1
Bath
1,144
Sq Ft
$118/Sq Ft
Est. Value
About This Home
This home is located at 211 Dallas Dr, Thomaston, GA 30286 and is currently estimated at $134,532, approximately $117 per square foot. 211 Dallas Dr is a home located in Upson County with nearby schools including Upson-Lee South Elementary School, Upson-Lee North Elementary School, and Upson-Lee Middle School.
Ownership History
Date
Name
Owned For
Owner Type
Purchase Details
Closed on
Jun 5, 2024
Sold by
West Central Georgia Bank
Bought by
Worthmore Investment Properties Llc
Current Estimated Value
Home Financials for this Owner
Home Financials are based on the most recent Mortgage that was taken out on this home.
Original Mortgage
$86,692
Outstanding Balance
$43,231
Interest Rate
7.09%
Mortgage Type
New Conventional
Estimated Equity
$91,301
Purchase Details
Closed on
Jun 4, 2024
Sold by
Worthmore Investment Properties Llc
Bought by
Huckaby Properties Llc
Home Financials for this Owner
Home Financials are based on the most recent Mortgage that was taken out on this home.
Original Mortgage
$86,692
Outstanding Balance
$43,231
Interest Rate
7.09%
Mortgage Type
New Conventional
Estimated Equity
$91,301
Purchase Details
Closed on
Apr 21, 2022
Sold by
Huckaby Jared A
Bought by
Huckaby Properties Llc
Purchase Details
Closed on
Feb 9, 2022
Sold by
King Family Rental Properties Llc
Bought by
Huckaby Jared and Huckaby Elizabeth
Purchase Details
Closed on
Jan 4, 2013
Sold by
King James T
Bought by
King Fam Rental Properties
Purchase Details
Closed on
Aug 21, 2012
Sold by
King Latrelle J
Bought by
King James T
Create a Home Valuation Report for This Property
The Home Valuation Report is an in-depth analysis detailing your home's value as well as a comparison with similar homes in the area
Purchase History
| Date | Buyer | Sale Price | Title Company |
|---|---|---|---|
| Worthmore Investment Properties Llc | -- | -- | |
| Huckaby Properties Llc | $85,000 | -- | |
| Huckaby Properties Llc | -- | -- | |
| Huckaby Jared | $815,000 | -- | |
| King Fam Rental Properties | -- | -- | |
| King James T | -- | -- |
Source: Public Records
Mortgage History
| Date | Status | Borrower | Loan Amount |
|---|---|---|---|
| Open | Huckaby Properties Llc | $86,692 |
Source: Public Records
Tax History
| Year | Tax Paid | Tax Assessment Tax Assessment Total Assessment is a certain percentage of the fair market value that is determined by local assessors to be the total taxable value of land and additions on the property. | Land | Improvement |
|---|---|---|---|---|
| 2025 | $1,194 | $40,898 | $12,575 | $28,323 |
| 2024 | $1,194 | $45,624 | $12,575 | $33,049 |
| 2023 | $1,135 | $43,341 | $12,575 | $30,766 |
| 2022 | $688 | $24,736 | $10,060 | $14,676 |
| 2021 | $651 | $22,850 | $10,060 | $12,790 |
| 2020 | $679 | $22,276 | $10,060 | $12,216 |
| 2019 | $560 | $17,634 | $6,288 | $11,346 |
| 2018 | $560 | $20,726 | $6,288 | $14,438 |
| 2017 | $500 | $14,310 | $4,716 | $9,594 |
| 2016 | $498 | $14,012 | $4,716 | $9,296 |
| 2015 | $494 | $14,011 | $4,716 | $9,296 |
| 2014 | $495 | $14,011 | $4,716 | $9,296 |
Source: Public Records
Map
Nearby Homes
- 315 Dallas Dr
- 213 Jefferson St
- 107 Hammerhead Ln Unit LOT 32
- 406 Brookwood Dr
- 326 Parkway Dr
- 615 Peachtree Dr
- 500 E Main St
- LOT 10 Triune Mill Rd
- 705 Triune Mill Rd
- 123 3rd St
- 217 Barnesville St
- 304 Cotton Ave
- 610 S Church St
- 807 Triune Mill Rd
- 108 Avenue G
- 314 S Green St
- 108 G Ave
- 0 Highway 19 S Unit 24061935
- 11 Wiley Dr
- 112 Pasley St
Your Personal Tour Guide
Ask me questions while you tour the home.