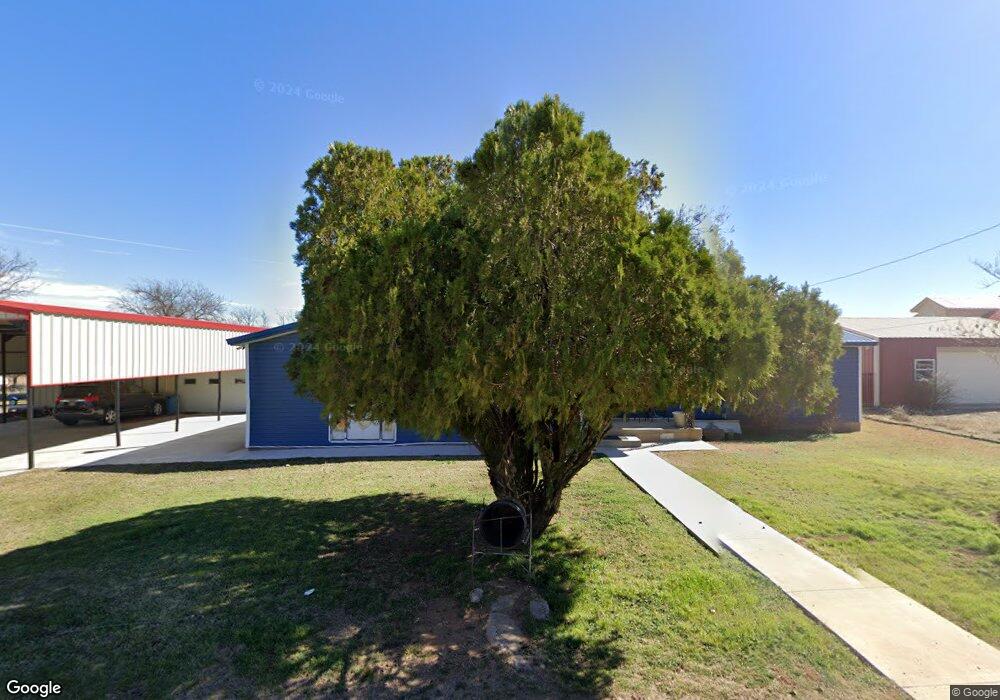
211 Osage Ave Geronimo, OK 73543
Estimated Value: $174,621 - $320,000
4
Beds
2
Baths
2,215
Sq Ft
$101/Sq Ft
Est. Value
About This Home
This home is located at 211 Osage Ave, Geronimo, OK 73543 and is currently estimated at $223,905, approximately $101 per square foot. 211 Osage Ave is a home located in Comanche County with nearby schools including Geronimo Elementary School and Geronimo High School.
Ownership History
Date
Name
Owned For
Owner Type
Purchase Details
Closed on
Feb 7, 2019
Sold by
Muniz Nikita Lee
Bought by
Cintran Ferdinand Muniz
Current Estimated Value
Purchase Details
Closed on
Oct 6, 2015
Sold by
Munizcintron Ferdinand
Purchase Details
Closed on
Feb 18, 2005
Sold by
Munizcintron Ferdinand and Munizcintron Madeline
Bought by
Munizcintron Ferdinand and Munizcintron Madeline
Home Financials for this Owner
Home Financials are based on the most recent Mortgage that was taken out on this home.
Original Mortgage
$55,000
Interest Rate
5.82%
Mortgage Type
New Conventional
Purchase Details
Closed on
Feb 17, 2005
Sold by
Muniz Madeline and Muniz Ferdinand
Bought by
Muniz Ferdinand and Muniz Madeline
Home Financials for this Owner
Home Financials are based on the most recent Mortgage that was taken out on this home.
Original Mortgage
$55,000
Interest Rate
5.82%
Mortgage Type
New Conventional
Purchase Details
Closed on
Aug 13, 1998
Sold by
Rivera Madeline
Purchase Details
Closed on
Nov 29, 1994
Sold by
Beasley James D
Create a Home Valuation Report for This Property
The Home Valuation Report is an in-depth analysis detailing your home's value as well as a comparison with similar homes in the area
Purchase History
| Date | Buyer | Sale Price | Title Company |
|---|---|---|---|
| Cintran Ferdinand Muniz | -- | None Available | |
| -- | -- | -- | |
| Munizcintron Ferdinand | -- | -- | |
| Muniz Ferdinand | -- | -- | |
| -- | -- | -- | |
| -- | -- | -- |
Source: Public Records
Mortgage History
| Date | Status | Borrower | Loan Amount |
|---|---|---|---|
| Previous Owner | Munizcintron Ferdinand | $55,000 |
Source: Public Records
Tax History
| Year | Tax Paid | Tax Assessment Tax Assessment Total Assessment is a certain percentage of the fair market value that is determined by local assessors to be the total taxable value of land and additions on the property. | Land | Improvement |
|---|---|---|---|---|
| 2025 | -- | $15,355 | $910 | $14,445 |
| 2024 | -- | $15,355 | $910 | $14,445 |
| 2023 | $0 | $14,473 | $910 | $13,563 |
| 2022 | $0 | $14,051 | $910 | $13,141 |
| 2021 | $635 | $13,643 | $1,212 | $12,431 |
| 2020 | $635 | $15,382 | $1,212 | $14,170 |
| 2019 | $635 | $7,446 | $1,212 | $6,234 |
| 2018 | $635 | $7,229 | $1,212 | $6,017 |
| 2017 | $638 | $7,018 | $1,212 | $5,806 |
| 2016 | $736 | $8,339 | $1,212 | $7,127 |
| 2015 | $617 | $7,056 | $809 | $6,247 |
| 2014 | $588 | $6,850 | $769 | $6,081 |
Source: Public Records
Map
Nearby Homes
- 403 Nebraska Ave
- 4 Cheyenne Ln
- 6 Cheyenne Ln
- 407 Bobwhite Rd
- 45th Street SE Baseline Rd
- 11042 SW Sheridan Rd
- 11158 SE 45th St
- TBD SE Holiday Rd
- 0 Base Line Rd
- 0 SE Flower Mound Rd
- TBD N 2620 Rd
- 180000 N 2600 Rd
- 31 SE Prairie View Ln
- 93 SE Prairie View Ln
- 53 SE Prairie View Ln
- 534 SE Lasso Loop
- TBD 4 Mile Rd
- 722 SW Butterfield Dr
- 8251 SE Woodlawn Rd
- 2502 & 2504 SW 38th St Unit 3625 & 3637 Wedgewoo
Your Personal Tour Guide
Ask me questions while you tour the home.