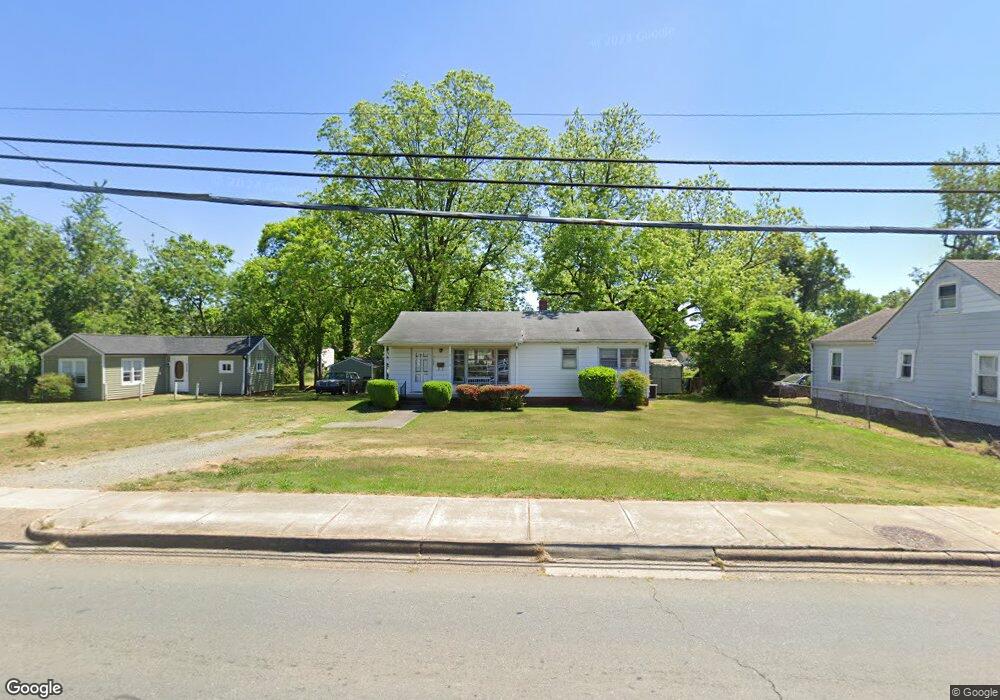
2110 Maple Ave Burlington, NC 27215
East Burlington NeighborhoodEstimated Value: $156,371 - $207,000
3
Beds
1
Bath
960
Sq Ft
$184/Sq Ft
Est. Value
About This Home
This home is located at 2110 Maple Ave, Burlington, NC 27215 and is currently estimated at $176,593, approximately $183 per square foot. 2110 Maple Ave is a home located in Alamance County with nearby schools including Harvey R. Newlin Elementary School, Graham Middle School, and Graham High School.
Ownership History
Date
Name
Owned For
Owner Type
Purchase Details
Closed on
Jan 1, 1990
Bought by
Clark Ila D
Current Estimated Value
Create a Home Valuation Report for This Property
The Home Valuation Report is an in-depth analysis detailing your home's value as well as a comparison with similar homes in the area
Home Values in the Area
Average Home Value in this Area
Purchase History
We collect this data history from publicly available records. To have your information removed, we recommend requesting removal directly through your county’s website.
| Date | Buyer | Sale Price | Title Company |
|---|---|---|---|
| Clark Ila D | -- | -- |
Source: Public Records
Tax History
| Year | Tax Paid | Tax Assessment Tax Assessment Total Assessment is a certain percentage of the fair market value that is determined by local assessors to be the total taxable value of land and additions on the property. | Land | Improvement |
|---|---|---|---|---|
| 2025 | $374 | $75,683 | $35,588 | $40,095 |
| 2024 | $355 | $75,683 | $35,588 | $40,095 |
| 2023 | $345 | $75,683 | $35,588 | $40,095 |
| 2022 | $448 | $72,236 | $43,045 | $29,191 |
| 2021 | $452 | $72,236 | $43,045 | $29,191 |
| 2020 | $455 | $72,236 | $43,045 | $29,191 |
| 2019 | $457 | $72,236 | $43,045 | $29,191 |
| 2018 | $215 | $72,236 | $43,045 | $29,191 |
| 2017 | $850 | $72,236 | $43,045 | $29,191 |
| 2016 | $885 | $76,269 | $43,045 | $33,224 |
| 2015 | $217 | $75,363 | $43,045 | $32,318 |
| 2014 | $199 | $75,363 | $43,045 | $32,318 |
Source: Public Records
Map
Nearby Homes
- 413 Bradley St
- 0 Bradley St
- 348 Albany St
- 606 Arden St
- 1905 Whitsett St
- 1519 Belmont St
- 1517 Belmont St
- 1515 Belmont St
- 211 W Harden St
- 2106 Joseph St
- 825 Parkwood St
- 814 Parkwood St
- 312 Cleveland Ave
- 1244 Lawndale Dr
- 1244 Lawndale Rd
- 915 Turrentine St
- 719 Center Ave
- 1304 Queen Ann St
- 928 E Davis St
- 308 Denny Cir
- 2108 Maple Ave
- 2112 Maple Ave
- 2106 Maple Ave
- 2114 Maple Ave
- 2131 Belmont St
- 2107 Maple Ave
- 2125 Belmont St
- 2109 Maple Ave
- 2102 Maple Ave
- 2105 Maple Ave
- 2202 Maple Ave
- 2135 Belmont St
- 2100 Maple Ave
- 2139 Belmont St
- 2119 Belmont St
- 2103 Maple Ave
- 2205 Belmont St
- 2010 Maple Ave
- 2201 Belmont St
- 611 Bradley St
Your Personal Tour Guide
Ask me questions while you tour the home.