
Seller's Agent in 2021
Maria Quinteiro
John L Scott
(425) 750-0086
4 in this area
59 Total Sales

Estimated Value: $691,000 - $775,000
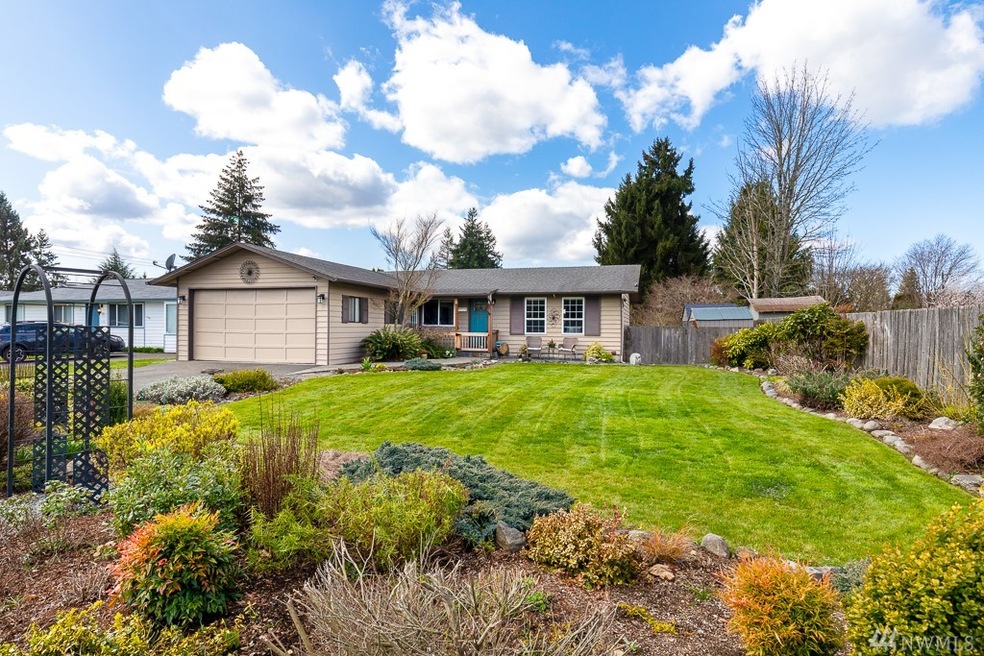
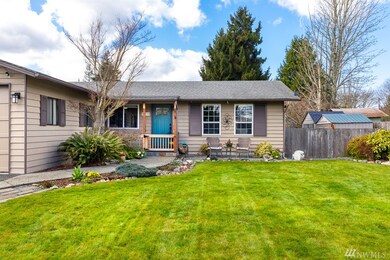
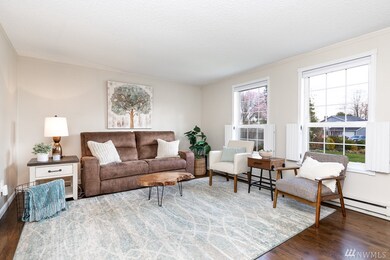
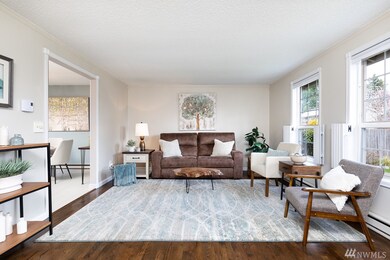
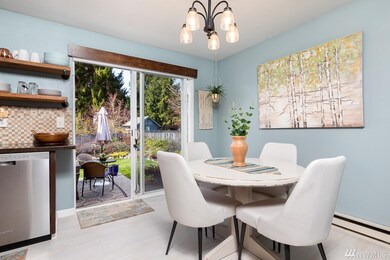
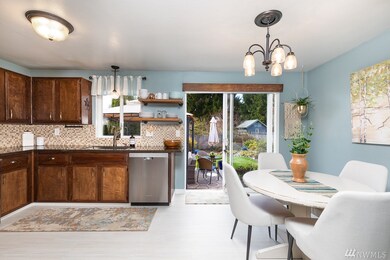
Impeccably maintained rambler on a large, beautifully landscaped lot. Tasteful design and pride of ownership shine throughout this home. The bathroom has been completely remodeled. Sliding door off the dining room leads to the expansive, fully fenced backyard with western exposure. Relax, entertain, and play in privacy and tranquility. This is the place to be during the summer! Garage is currently a home-based salon but can easily be converted back. Great neighborhood is conveniently near Edmonds schools and bus line to Lynnwood Transit Center with future light rail station, Edmonds College, and Canyon Park. And only a short drive to Alderwood Mall area, Canyon Park, and I-5/I-405 access. Welcome home!
Last Agent to Sell the Property
John L. Scott, Inc. License #71186 Listed on: 04/02/2021
Source: Northwest Multiple Listing Service (NWMLS)
MLS#: NWM1751489
We collect this data history from publicly available records. To have your information removed, we recommend requesting removal directly through your county’s website.
We collect this data history from publicly available records. To have your information removed, we recommend requesting removal directly through your county’s website.
| Date | Buyer | Sale Price | Title Company |
|---|---|---|---|
| $122,950 | Transamerica Title Insurance |
We collect this data history from publicly available records. To have your information removed, we recommend requesting removal directly through your county’s website.
| Date | Event | Price | List to Sale | Price per Sq Ft |
|---|---|---|---|---|
| 04/30/2021 04/30/21 | Sold | $626,000 | +15.9% | $565 / Sq Ft |
| 04/07/2021 04/07/21 | Pending | -- | -- | -- |
| 04/02/2021 04/02/21 | For Sale | $540,000 | -- | $488 / Sq Ft |
We collect this data history from publicly available records. To have your information removed, we recommend requesting removal directly through your county’s website.
| Year | Tax Paid | Tax Assessment Tax Assessment Total Assessment is a certain percentage of the fair market value that is determined by local assessors to be the total taxable value of land and additions on the property. | Land | Improvement |
|---|---|---|---|---|
| 2026 | $6,005 | $729,600 | $527,000 | $202,600 |
| 2025 | $5,261 | $651,700 | $460,000 | $191,700 |
| 2024 | $5,261 | $631,700 | $440,000 | $191,700 |
| 2023 | $5,642 | $709,600 | $519,000 | $190,600 |
| 2022 | $4,873 | $497,400 | $363,000 | $134,400 |
| 2020 | $4,821 | $434,900 | $317,000 | $117,900 |
| 2019 | $4,268 | $382,300 | $265,000 | $117,300 |
| 2018 | $4,301 | $339,600 | $235,000 | $104,600 |
| 2017 | $3,458 | $281,400 | $185,000 | $96,400 |
| 2016 | $3,176 | $258,900 | $165,000 | $93,900 |
| 2015 | $3,250 | $252,100 | $155,000 | $97,100 |
| 2013 | $2,780 | $203,900 | $127,000 | $76,900 |
Seller's Agent in 2021
Maria Quinteiro
John L Scott
(425) 750-0086
4 in this area
59 Total Sales
Buyer's Agent in 2021
Christina Brown
John L Scott
(206) 669-2424
15 Total Sales
Source: Northwest Multiple Listing Service (NWMLS)
MLS Number: NWM1751489
APN: 004245-000-016-00
Disclaimer: Certain information contained herein is derived from information provided by parties other than Homes.com. All information provided is deemed reliable, but is not guaranteed to be accurate and should be independently verified.
![]() All data is obtained from various sources and may not have been verified by broker or MLS GRID. Supplied Open House Information is subject to change without notice. All information should be independently reviewed and verified for accuracy. Properties may or may not be listed by the office/agent presenting the information. Listing information is provided by the Northwest Multiple Listing Service (NWMLS). Property information is based on available data that may include MLS information, county records, and other sources. Listings marked with the 3 tree icon and provided by NWMLS. All properties are subject to prior sale or withdrawal. IDX information is provided exclusively for consumers’ personal noncommercial use, that it may not be used for any purpose other than to identify prospective properties consumers may be interested in purchasing, that the data is deemed reliable but is not guaranteed by MLS GRID. ©2026 NWMLS.
All data is obtained from various sources and may not have been verified by broker or MLS GRID. Supplied Open House Information is subject to change without notice. All information should be independently reviewed and verified for accuracy. Properties may or may not be listed by the office/agent presenting the information. Listing information is provided by the Northwest Multiple Listing Service (NWMLS). Property information is based on available data that may include MLS information, county records, and other sources. Listings marked with the 3 tree icon and provided by NWMLS. All properties are subject to prior sale or withdrawal. IDX information is provided exclusively for consumers’ personal noncommercial use, that it may not be used for any purpose other than to identify prospective properties consumers may be interested in purchasing, that the data is deemed reliable but is not guaranteed by MLS GRID. ©2026 NWMLS.
Based on information submitted to the MLS GRID
Listings courtesy of Northwest Multiple Listing Service (NWMLS) as distributed by MLS GRID
Ask me questions while you tour the home.