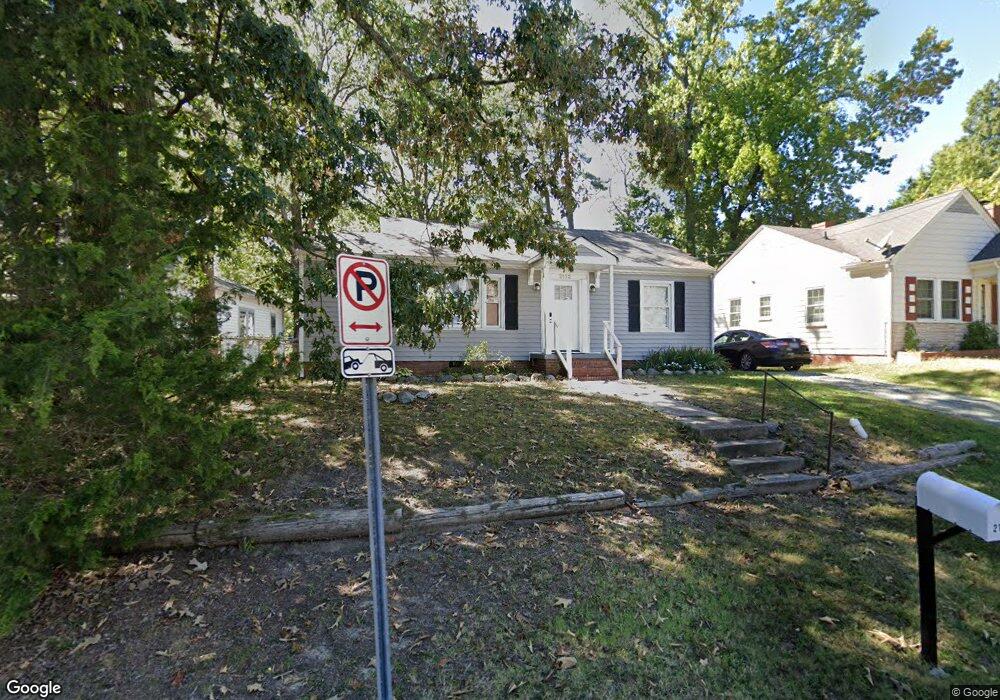
2112 Duncan St Durham, NC 27707
Spaulding Community NeighborhoodEstimated Value: $152,000 - $196,160
2
Beds
1
Bath
863
Sq Ft
$196/Sq Ft
Est. Value
About This Home
This home is located at 2112 Duncan St, Durham, NC 27707 and is currently estimated at $169,290, approximately $196 per square foot. 2112 Duncan St is a home located in Durham County with nearby schools including C. C. Spaulding Elementary, Morehead Montessori, and Sherwood Githens Middle.
Ownership History
Date
Name
Owned For
Owner Type
Purchase Details
Closed on
Feb 3, 2021
Sold by
Carnes Antoine R and Carnes Tamara
Bought by
Rush Adventrues Llc
Current Estimated Value
Purchase Details
Closed on
Dec 20, 2007
Sold by
Hsbc Mortgage Services Inc
Bought by
Carnes Antoine R and Carnes Tamara
Purchase Details
Closed on
Aug 17, 2007
Sold by
Horne Robert
Bought by
Hsbc Mortgage Services Inc
Purchase Details
Closed on
Mar 2, 2005
Sold by
Horne Robert Thomas
Bought by
Horne Robert Thomas and Waller Joyce
Create a Home Valuation Report for This Property
The Home Valuation Report is an in-depth analysis detailing your home's value as well as a comparison with similar homes in the area
Home Values in the Area
Average Home Value in this Area
Purchase History
| Date | Buyer | Sale Price | Title Company |
|---|---|---|---|
| Rush Adventrues Llc | $105,500 | None Available | |
| Carnes Antoine R | $26,500 | None Available | |
| Hsbc Mortgage Services Inc | $38,902 | None Available | |
| Horne Robert Thomas | -- | -- |
Source: Public Records
Tax History
| Year | Tax Paid | Tax Assessment Tax Assessment Total Assessment is a certain percentage of the fair market value that is determined by local assessors to be the total taxable value of land and additions on the property. | Land | Improvement |
|---|---|---|---|---|
| 2025 | $1,960 | $197,734 | $97,125 | $100,609 |
| 2024 | $1,442 | $103,367 | $27,775 | $75,592 |
| 2023 | $1,354 | $103,367 | $27,775 | $75,592 |
| 2022 | $1,323 | $103,367 | $27,775 | $75,592 |
| 2021 | $1,317 | $103,367 | $27,775 | $75,592 |
| 2020 | $1,286 | $103,367 | $27,775 | $75,592 |
| 2019 | $1,286 | $103,367 | $27,775 | $75,592 |
| 2018 | $776 | $57,171 | $13,887 | $43,284 |
| 2017 | $770 | $57,171 | $13,887 | $43,284 |
| 2016 | $744 | $57,171 | $13,887 | $43,284 |
| 2015 | $610 | $44,052 | $13,261 | $30,791 |
| 2014 | $610 | $44,052 | $13,261 | $30,791 |
Source: Public Records
Map
Nearby Homes
Your Personal Tour Guide
Ask me questions while you tour the home.