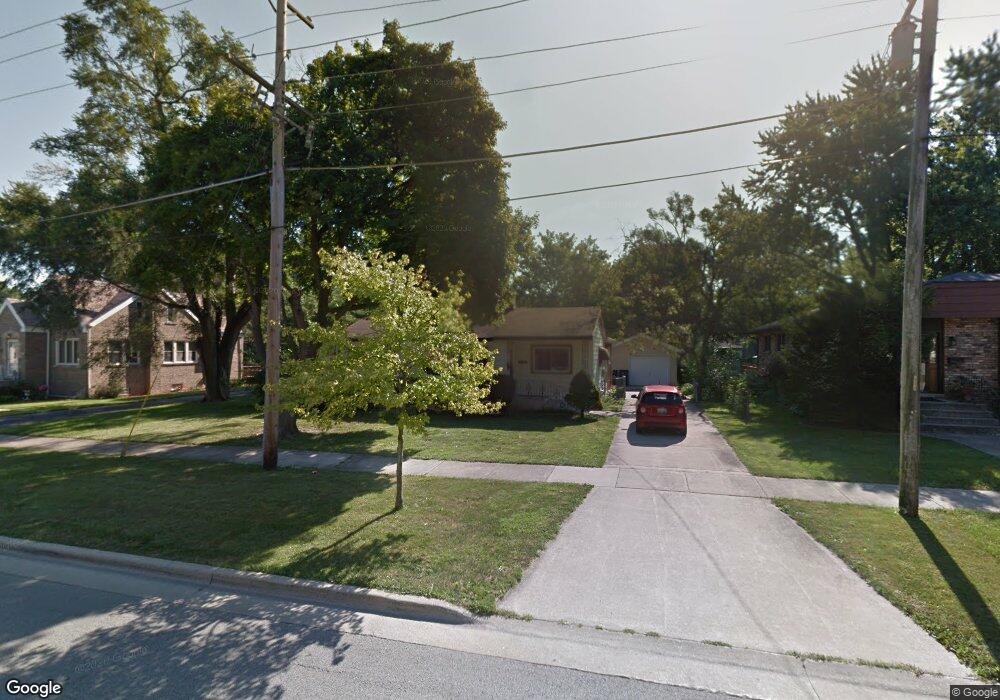
21129 Main St Matteson, IL 60443
Old Matteson NeighborhoodEstimated Value: $164,000 - $193,000
About This Home
This home is located at 21129 Main St, Matteson, IL 60443 and is currently estimated at $179,000, approximately $150 per square foot. 21129 Main St is a home located in Cook County with nearby schools including Illinois School, Matteson Elementary School, and Sauk Elementary School.
Ownership History
We collect this data history from publicly available records. To have your information removed, we recommend requesting removal directly through your county’s website.
Purchase Details
Home Financials for this Owner
Home Financials are based on the most recent Mortgage that was taken out on this home.Purchase Details
Home Values in the Area
Average Home Value in this Area
Purchase History
We collect this data history from publicly available records. To have your information removed, we recommend requesting removal directly through your county’s website.
| Date | Buyer | Sale Price | Title Company |
|---|---|---|---|
| $84,000 | -- | ||
| -- | -- |
Mortgage History
We collect this data history from publicly available records. To have your information removed, we recommend requesting removal directly through your county’s website.
| Date | Status | Borrower | Loan Amount |
|---|---|---|---|
| Open | $48,900 |
Tax History
We collect this data history from publicly available records. To have your information removed, we recommend requesting removal directly through your county’s website.
| Year | Tax Paid | Tax Assessment Tax Assessment Total Assessment is a certain percentage of the fair market value that is determined by local assessors to be the total taxable value of land and additions on the property. | Land | Improvement |
|---|---|---|---|---|
| 2025 | $4,416 | $14,000 | $4,290 | $9,710 |
| 2024 | $4,416 | $14,000 | $4,290 | $9,710 |
| 2023 | $2,310 | $14,000 | $4,290 | $9,710 |
| 2022 | $2,310 | $7,681 | $3,754 | $3,927 |
| 2021 | $2,392 | $7,679 | $3,753 | $3,926 |
| 2020 | $2,331 | $7,679 | $3,753 | $3,926 |
| 2019 | $2,841 | $8,918 | $3,485 | $5,433 |
| 2018 | $2,837 | $8,918 | $3,485 | $5,433 |
| 2017 | $2,753 | $8,918 | $3,485 | $5,433 |
| 2016 | $2,909 | $8,414 | $3,217 | $5,197 |
| 2015 | $2,823 | $8,414 | $3,217 | $5,197 |
| 2014 | $2,760 | $8,414 | $3,217 | $5,197 |
| 2013 | $3,033 | $9,656 | $3,217 | $6,439 |
Map
- 21142 Locust St
- 547 Homan Ave
- 1034 Pine Ave
- 3615 214th St
- 20864 Thornwood Dr
- 3732 214th St
- 3704 214th Place
- 888 Woodstock Rd
- 118 Indiana St
- 126 Indiana St
- 303 Jackson St
- 230 Hickory St
- 21406 S Jean Ave
- 21607 Main St
- 3328 Holden Cir
- 20636 Greenwood Dr
- 3050 London Dr
- 831 Violet Ln
- 20920 Governors Hwy
- 20626 Greenwood Dr
Ask me questions while you tour the home.