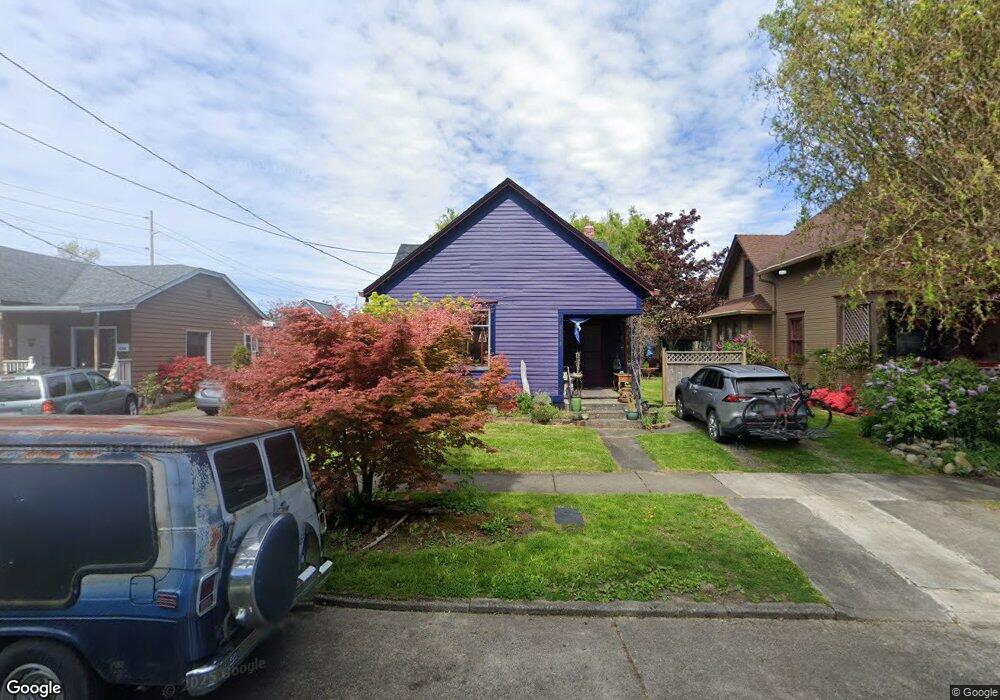
2113 A St Bellingham, WA 98225
Lettered Streets NeighborhoodEstimated Value: $532,749 - $617,000
2
Beds
1
Bath
1,144
Sq Ft
$508/Sq Ft
Est. Value
About This Home
This home is located at 2113 A St, Bellingham, WA 98225 and is currently estimated at $581,187, approximately $508 per square foot. 2113 A St is a home located in Whatcom County with nearby schools including Parkview Elementary School, Whatcom Middle School, and Bellingham High School.
Ownership History
Date
Name
Owned For
Owner Type
Purchase Details
Closed on
Jan 4, 2001
Sold by
Demarsh Joseph P and Martin Debra L
Bought by
Depaola Daniel F and Taylor Lauren J
Current Estimated Value
Home Financials for this Owner
Home Financials are based on the most recent Mortgage that was taken out on this home.
Original Mortgage
$76,800
Outstanding Balance
$27,587
Interest Rate
7.71%
Estimated Equity
$553,600
Create a Home Valuation Report for This Property
The Home Valuation Report is an in-depth analysis detailing your home's value as well as a comparison with similar homes in the area
Home Values in the Area
Average Home Value in this Area
Purchase History
We collect this data history from publicly available records. To have your information removed, we recommend requesting removal directly through your county’s website.
| Date | Buyer | Sale Price | Title Company |
|---|---|---|---|
| Depaola Daniel F | $96,000 | Chicago Title Insurance |
Source: Public Records
Mortgage History
We collect this data history from publicly available records. To have your information removed, we recommend requesting removal directly through your county’s website.
| Date | Status | Borrower | Loan Amount |
|---|---|---|---|
| Open | Depaola Daniel F | $76,800 |
Source: Public Records
Tax History
| Year | Tax Paid | Tax Assessment Tax Assessment Total Assessment is a certain percentage of the fair market value that is determined by local assessors to be the total taxable value of land and additions on the property. | Land | Improvement |
|---|---|---|---|---|
| 2025 | $4,004 | $503,587 | $253,696 | $249,891 |
| 2024 | $3,903 | $488,913 | $246,304 | $242,609 |
| 2023 | $3,903 | $501,332 | $252,560 | $248,772 |
| 2022 | $3,186 | $432,190 | $217,728 | $214,462 |
| 2021 | $3,126 | $343,008 | $172,800 | $170,208 |
| 2020 | $3,066 | $317,600 | $160,000 | $157,600 |
| 2019 | $2,745 | $301,100 | $141,415 | $159,685 |
| 2018 | $2,764 | $270,287 | $126,965 | $143,322 |
| 2017 | $2,383 | $232,708 | $109,310 | $123,398 |
| 2016 | $2,086 | $209,648 | $98,090 | $111,558 |
| 2015 | $2,045 | $191,042 | $89,590 | $101,452 |
| 2014 | -- | $181,254 | $85,000 | $96,254 |
| 2013 | -- | $169,150 | $73,500 | $95,650 |
Source: Public Records
Map
Nearby Homes
Your Personal Tour Guide
Ask me questions while you tour the home.