Estimated Value: $229,000 - $242,000
About This Home
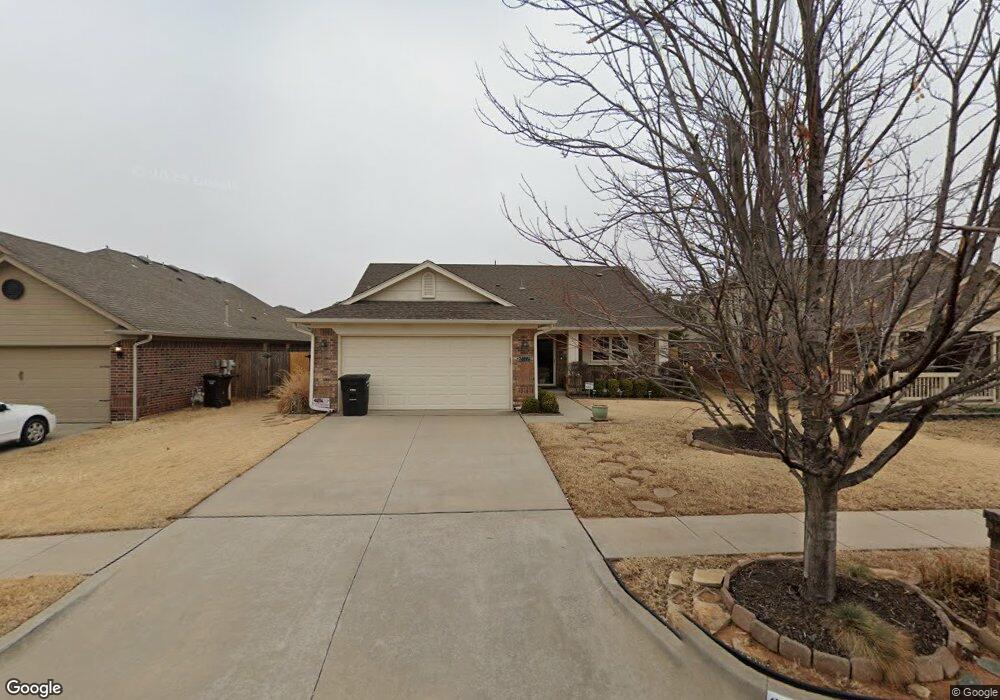
This home is located at 2117 SE 8th St, Moore, OK 73160 and is currently estimated at $235,201, approximately $163 per square foot. 2117 SE 8th St is a home located in Cleveland County with nearby schools including Heritage Trails Elementary School, Highland East Junior High School, and Moore High School.
Ownership History
We collect this data history from publicly available records. To have your information removed, we recommend requesting removal directly through your county’s website.
Purchase Details
Purchase Details
Home Financials for this Owner
Home Financials are based on the most recent Mortgage that was taken out on this home.Purchase Details
Home Financials for this Owner
Home Financials are based on the most recent Mortgage that was taken out on this home.Home Values in the Area
Average Home Value in this Area
Purchase History
We collect this data history from publicly available records. To have your information removed, we recommend requesting removal directly through your county’s website.
| Date | Buyer | Sale Price | Title Company |
|---|---|---|---|
| -- | None Available | ||
| $143,000 | None Available | ||
| $22,000 | None Available |
Mortgage History
We collect this data history from publicly available records. To have your information removed, we recommend requesting removal directly through your county’s website.
| Date | Status | Borrower | Loan Amount |
|---|---|---|---|
| Open | $114,100 | ||
| Previous Owner | $183,257 |
Tax History
We collect this data history from publicly available records. To have your information removed, we recommend requesting removal directly through your county’s website.
| Year | Tax Paid | Tax Assessment Tax Assessment Total Assessment is a certain percentage of the fair market value that is determined by local assessors to be the total taxable value of land and additions on the property. | Land | Improvement |
|---|---|---|---|---|
| 2025 | $2,107 | $18,194 | $3,854 | $14,340 |
| 2023 | $2,096 | $18,194 | $4,382 | $13,812 |
| 2022 | $2,127 | $18,194 | $3,714 | $14,480 |
| 2021 | $2,070 | $17,664 | $3,786 | $13,878 |
| 2020 | $2,008 | $17,150 | $3,426 | $13,724 |
| 2019 | $1,982 | $16,650 | $3,000 | $13,650 |
| 2018 | $1,929 | $16,234 | $2,400 | $13,834 |
| 2017 | $1,938 | $16,234 | $0 | $0 |
| 2016 | $1,952 | $16,234 | $2,400 | $13,834 |
| 2015 | $1,732 | $15,932 | $2,334 | $13,598 |
| 2014 | $1,718 | $15,467 | $2,457 | $13,010 |
Map
- 613 Applewood St
- 2025 Wimberley Creek Dr
- 2112 SE 9th St
- 509 Beechwood Way
- 1009 Ashwood Ln
- 2433 SE 12th St
- 1701 Pinewood Dr
- 1113 Kelsi Dr
- 1117 Kelsi Dr
- 1328 Brayden Dr
- 1809 Parkway Dr
- 1001 Aspen Ct
- 505 Pinewood Dr
- 2713 SE 8th St
- 105 S Olde Bridge Rd
- 1808 SE 15th St
- 1412 SE 6th St
- 1117 Samantha Ln
- 1113 Lindsey Ln
- 601 Dayton Cir
Ask me questions while you tour the home.