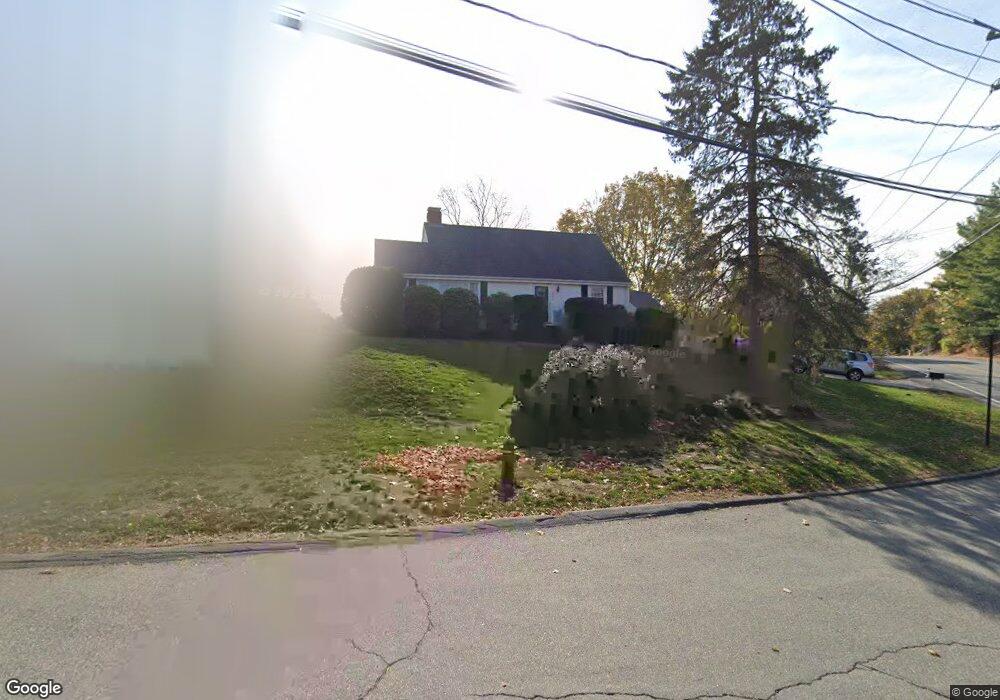
212 High St Winchester, MA 01890
West Side NeighborhoodEstimated Value: $1,185,000 - $1,336,000
3
Beds
3
Baths
2,178
Sq Ft
$583/Sq Ft
Est. Value
About This Home
This home is located at 212 High St, Winchester, MA 01890 and is currently estimated at $1,269,216, approximately $582 per square foot. 212 High St is a home located in Middlesex County with nearby schools including Vinson-Owen Elementary School, McCall Middle School, and Winchester High School.
Ownership History
Date
Name
Owned For
Owner Type
Purchase Details
Closed on
Aug 28, 2009
Sold by
Greenough Scott and Greenough Kelly
Bought by
Shi Yang and Hou Yanxia
Current Estimated Value
Home Financials for this Owner
Home Financials are based on the most recent Mortgage that was taken out on this home.
Original Mortgage
$410,000
Outstanding Balance
$267,866
Interest Rate
5.17%
Mortgage Type
Purchase Money Mortgage
Estimated Equity
$1,001,350
Purchase Details
Closed on
Jul 1, 2003
Sold by
Doherty M Janice and Janice Mcadams M
Bought by
Greenough Kelly and Greenough Scott
Home Financials for this Owner
Home Financials are based on the most recent Mortgage that was taken out on this home.
Original Mortgage
$487,800
Interest Rate
5.53%
Mortgage Type
Purchase Money Mortgage
Create a Home Valuation Report for This Property
The Home Valuation Report is an in-depth analysis detailing your home's value as well as a comparison with similar homes in the area
Home Values in the Area
Average Home Value in this Area
Purchase History
| Date | Buyer | Sale Price | Title Company |
|---|---|---|---|
| Shi Yang | $555,000 | -- | |
| Greenough Kelly | $542,000 | -- |
Source: Public Records
Mortgage History
| Date | Status | Borrower | Loan Amount |
|---|---|---|---|
| Open | Shi Yang | $410,000 | |
| Previous Owner | Greenough Kelly | $487,800 |
Source: Public Records
Tax History
| Year | Tax Paid | Tax Assessment Tax Assessment Total Assessment is a certain percentage of the fair market value that is determined by local assessors to be the total taxable value of land and additions on the property. | Land | Improvement |
|---|---|---|---|---|
| 2025 | $119 | $1,075,500 | $733,800 | $341,700 |
| 2024 | $11,738 | $1,036,000 | $697,200 | $338,800 |
| 2023 | $10,948 | $927,800 | $605,400 | $322,400 |
| 2022 | $10,919 | $872,800 | $550,400 | $322,400 |
| 2021 | $10,256 | $799,400 | $477,000 | $322,400 |
| 2020 | $9,791 | $790,200 | $467,800 | $322,400 |
| 2019 | $9,015 | $744,400 | $422,000 | $322,400 |
| 2018 | $9,951 | $714,900 | $401,800 | $313,100 |
| 2017 | $8,551 | $696,300 | $401,800 | $294,500 |
| 2016 | $7,937 | $679,500 | $394,400 | $285,100 |
| 2015 | $7,779 | $640,800 | $366,900 | $273,900 |
| 2014 | $7,900 | $624,000 | $357,800 | $266,200 |
Source: Public Records
Map
Nearby Homes
- 37 Mayflower Rd
- 15 Mayflower Rd
- 114 Johnson Rd
- 15 Edward Dr Unit 15
- 54 Johnson Rd
- 143 Wright St
- 11 Lorraine Terrace
- 12 Thornberry Rd
- 30 Whipple Rd
- 337 Washington St
- 281 Forest St
- 72 Thesda St
- 29 Pilgrim Dr
- 20 Amberwood Dr
- 28 Emerson Rd
- 44 Tyler Rd
- 12 Wincrest Dr
- 65 High St
- 0 Reed St
- 15 Gershon Way Unit 15
Your Personal Tour Guide
Ask me questions while you tour the home.