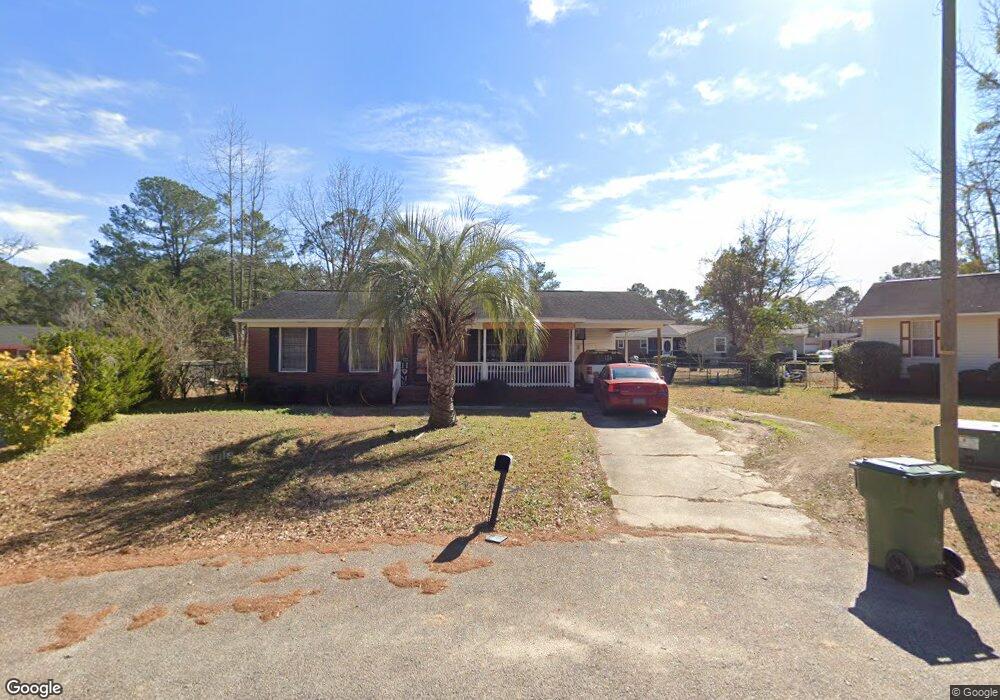
212 Lester Ave Florence, SC 29501
Estimated Value: $122,150 - $145,000
3
Beds
2
Baths
1,189
Sq Ft
$114/Sq Ft
Est. Value
About This Home
This home is located at 212 Lester Ave, Florence, SC 29501 and is currently estimated at $135,788, approximately $114 per square foot. 212 Lester Ave is a home located in Florence County with nearby schools including North Vista Elementary School, Williams Middle School, and Wilson High School.
Ownership History
Date
Name
Owned For
Owner Type
Purchase Details
Closed on
Sep 29, 2011
Sold by
Chandler Jonathan D and Burr Shannon D
Bought by
Davis Tasha
Current Estimated Value
Home Financials for this Owner
Home Financials are based on the most recent Mortgage that was taken out on this home.
Original Mortgage
$65,650
Interest Rate
4.25%
Mortgage Type
FHA
Purchase Details
Closed on
Apr 4, 2011
Sold by
Chandler Jonathan D
Bought by
Chandler Jonathan D and Burr Shannon D
Purchase Details
Closed on
Jun 23, 2010
Sold by
Powe Joseph
Bought by
Williamsburg First National Bank
Purchase Details
Closed on
May 24, 2007
Sold by
Novastar Mortgage Inc
Bought by
Powe Joseph
Purchase Details
Closed on
Mar 21, 2007
Sold by
Bivins Christopher and Bivins Doris Otumba
Bought by
Mortgage Electronic Registration Systems
Purchase Details
Closed on
Nov 20, 2003
Sold by
Otumba Doris
Bought by
Bivins Doris and Bivins Christopher
Create a Home Valuation Report for This Property
The Home Valuation Report is an in-depth analysis detailing your home's value as well as a comparison with similar homes in the area
Purchase History
| Date | Buyer | Sale Price | Title Company |
|---|---|---|---|
| Davis Tasha | $79,000 | -- | |
| Chandler Jonathan D | -- | -- | |
| Chandler Jonathan D | $26,000 | -- | |
| Williamsburg First National Bank | -- | -- | |
| Powe Joseph | $60,000 | None Available | |
| Mortgage Electronic Registration Systems | $10,000 | None Available | |
| Bivins Doris | -- | -- |
Source: Public Records
Mortgage History
| Date | Status | Borrower | Loan Amount |
|---|---|---|---|
| Previous Owner | Davis Tasha | $65,650 |
Source: Public Records
Tax History
| Year | Tax Paid | Tax Assessment Tax Assessment Total Assessment is a certain percentage of the fair market value that is determined by local assessors to be the total taxable value of land and additions on the property. | Land | Improvement |
|---|---|---|---|---|
| 2025 | $443 | $4,384 | $400 | $3,984 |
| 2024 | $410 | $4,384 | $400 | $3,984 |
| 2023 | $322 | $3,020 | $280 | $2,740 |
| 2022 | $390 | $3,020 | $0 | $0 |
| 2021 | $395 | $3,020 | $0 | $0 |
| 2020 | $378 | $3,020 | $0 | $0 |
| 2019 | $354 | $3,020 | $280 | $2,740 |
| 2018 | $327 | $3,020 | $0 | $0 |
| 2017 | $310 | $3,020 | $0 | $0 |
| 2016 | $275 | $3,020 | $0 | $0 |
| 2015 | $288 | $3,020 | $0 | $0 |
| 2014 | $249 | $3,020 | $280 | $2,740 |
Source: Public Records
Map
Nearby Homes
- 238 Lester Ave
- 414 W Vista St
- 404 W Vista St
- 112 Waterman Ave
- 207 Byrd Ln
- 1551 N Sierra Range
- 1407 Aaron Cir
- 139 Wingate Ave
- TBD W Ashby Rd
- TBD W Leggs Cir
- 813 N Dargan St
- 609 N Mcqueen St
- 209 Marlboro St
- 1226 N Brand St
- 719 Maxwell St
- 701 Chase St
- 360 N Dargan St
- 1766 Williamsburg Cir
- 613 Carver St
- TBD Fortune St
- 214 Lester Ave
- 210 Lester Ave
- 1331 Rebecca St
- 205 Cheryl Ct
- 1333 Rebecca St
- 1327 Rebecca St
- 1337 Rebecca St
- 222 Lester Ave
- 209 Cheryl Ct
- 1341 Marshall Ave
- 211 Lester Ave
- 224 Lester Ave
- 213 Lester Ave
- 207 Lester Ave
- 211 Cheryl Ct
- 1328 Rebecca St
- 200 Cheryl Ct
- 1326 Rebecca St
- 1332 Rebecca St
- 205 Lester Ave
Your Personal Tour Guide
Ask me questions while you tour the home.