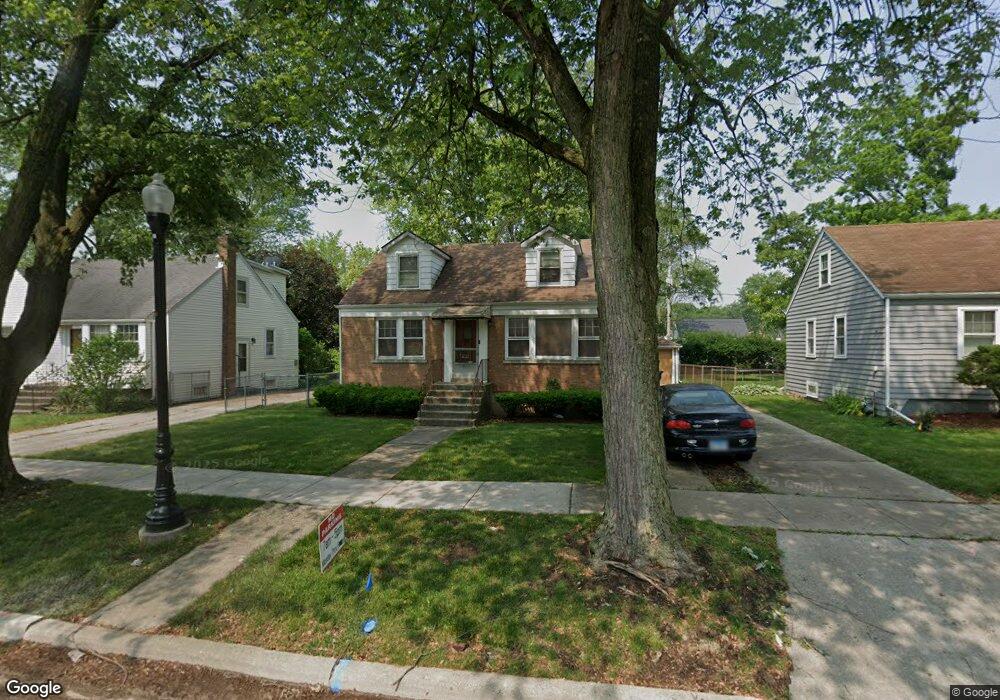
21202 Main St Matteson, IL 60443
Old Matteson NeighborhoodEstimated Value: $160,000 - $170,068
4
Beds
1
Bath
1,224
Sq Ft
$134/Sq Ft
Est. Value
About This Home
This home is located at 21202 Main St, Matteson, IL 60443 and is currently estimated at $164,267, approximately $134 per square foot. 21202 Main St is a home located in Cook County with nearby schools including Illinois School, Matteson Elementary School, and Sauk Elementary School.
Ownership History
Date
Name
Owned For
Owner Type
Purchase Details
Closed on
Jan 31, 1997
Sold by
Williamson Robert V
Bought by
Dail Bonny
Current Estimated Value
Home Financials for this Owner
Home Financials are based on the most recent Mortgage that was taken out on this home.
Original Mortgage
$89,622
Outstanding Balance
$8,708
Interest Rate
7.93%
Mortgage Type
FHA
Estimated Equity
$155,559
Create a Home Valuation Report for This Property
The Home Valuation Report is an in-depth analysis detailing your home's value as well as a comparison with similar homes in the area
Home Values in the Area
Average Home Value in this Area
Purchase History
We collect this data history from publicly available records. To have your information removed, we recommend requesting removal directly through your county’s website.
| Date | Buyer | Sale Price | Title Company |
|---|---|---|---|
| Dail Bonny | $90,000 | -- |
Source: Public Records
Mortgage History
We collect this data history from publicly available records. To have your information removed, we recommend requesting removal directly through your county’s website.
| Date | Status | Borrower | Loan Amount |
|---|---|---|---|
| Open | Dail Bonny | $89,622 |
Source: Public Records
Tax History
| Year | Tax Paid | Tax Assessment Tax Assessment Total Assessment is a certain percentage of the fair market value that is determined by local assessors to be the total taxable value of land and additions on the property. | Land | Improvement |
|---|---|---|---|---|
| 2025 | -- | $15,000 | $2,860 | $12,140 |
| 2024 | -- | $15,000 | $2,860 | $12,140 |
| 2023 | -- | $15,000 | $2,860 | $12,140 |
| 2022 | $0 | $7,682 | $2,503 | $5,179 |
| 2021 | $752 | $7,680 | $2,502 | $5,178 |
| 2020 | $752 | $7,680 | $2,502 | $5,178 |
| 2019 | $1,112 | $9,008 | $2,323 | $6,685 |
| 2018 | $1,106 | $9,008 | $2,323 | $6,685 |
| 2017 | $1,121 | $9,008 | $2,323 | $6,685 |
| 2016 | $330 | $8,743 | $2,145 | $6,598 |
| 2015 | $343 | $8,743 | $2,145 | $6,598 |
| 2014 | $326 | $8,743 | $2,145 | $6,598 |
| 2013 | $305 | $10,325 | $2,145 | $8,180 |
Source: Public Records
Map
Nearby Homes
- 21142 Locust St
- 3802 213th Place
- 3704 214th Place
- 547 Homan Ave
- 888 Woodstock Rd
- 21406 S Jean Ave
- 303 Jackson St
- 30 Strauss Ln
- 118 Indiana St
- 126 Indiana St
- 3812 216th St
- 21607 Main St
- 230 Hickory St
- 21602 Dogwood Rd Unit 1184
- 3328 Holden Cir
- 3817 216th Place
- 442 Homan Ave
- 831 Violet Ln
- 21635 Dogwood Rd Unit 1165
- 3865 216th Place
- 21153 Locust St
- 21149 Locust St
- 21201 Locust St
- 21145 Locust St
- 21154 Main St
- 21150 Main St
- 21141 Locust St
- 21211 Locust St
- 21146 Main St
- 21208 Main St
- 21154 Locust St
- 21150 Locust St
- 21202 Locust St
- 21142 Main St
- 21212 Main St
- 21146 Locust St
- 21208 Locust St
- 21135 Locust St
- 3613 211th Place
- 21212 Locust St
Your Personal Tour Guide
Ask me questions while you tour the home.