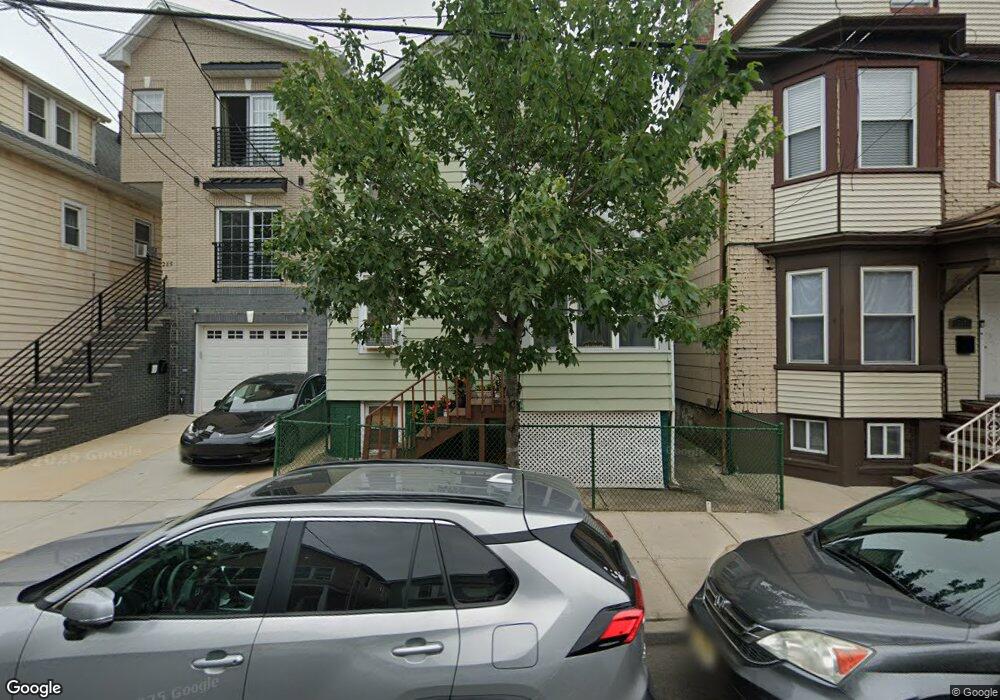
213 John St Harrison, NJ 07029
Estimated Value: $454,565 - $527,000
Studio
--
Bath
1,460
Sq Ft
$338/Sq Ft
Est. Value
About This Home
This home is located at 213 John St, Harrison, NJ 07029 and is currently estimated at $493,891, approximately $338 per square foot. 213 John St is a home located in Hudson County with nearby schools including Kennedy Elementary School, Hamilton Intermediate School, and Lincoln No. 3 Elementary School.
Ownership History
Date
Name
Owned For
Owner Type
Purchase Details
Closed on
Nov 15, 2002
Sold by
Alvarez Juan and Alvarez Rosa
Bought by
Azabache Jose G
Current Estimated Value
Home Financials for this Owner
Home Financials are based on the most recent Mortgage that was taken out on this home.
Original Mortgage
$180,300
Interest Rate
6.08%
Mortgage Type
FHA
Create a Home Valuation Report for This Property
The Home Valuation Report is an in-depth analysis detailing your home's value as well as a comparison with similar homes in the area
Home Values in the Area
Average Home Value in this Area
Purchase History
| Date | Buyer | Sale Price | Title Company |
|---|---|---|---|
| Azabache Jose G | $187,000 | -- |
Source: Public Records
Mortgage History
| Date | Status | Borrower | Loan Amount |
|---|---|---|---|
| Previous Owner | Azabache Jose G | $180,300 |
Source: Public Records
Tax History
| Year | Tax Paid | Tax Assessment Tax Assessment Total Assessment is a certain percentage of the fair market value that is determined by local assessors to be the total taxable value of land and additions on the property. | Land | Improvement |
|---|---|---|---|---|
| 2025 | $6,932 | $295,500 | $177,000 | $118,500 |
| 2024 | $6,794 | $295,500 | $177,000 | $118,500 |
| 2023 | $6,794 | $295,500 | $177,000 | $118,500 |
| 2022 | $6,740 | $295,500 | $177,000 | $118,500 |
| 2021 | $6,628 | $295,500 | $177,000 | $118,500 |
| 2020 | $6,737 | $295,500 | $177,000 | $118,500 |
| 2019 | $6,375 | $87,800 | $39,200 | $48,600 |
| 2018 | $6,335 | $87,800 | $39,200 | $48,600 |
| 2017 | $6,356 | $87,800 | $39,200 | $48,600 |
| 2016 | $6,325 | $87,800 | $39,200 | $48,600 |
| 2015 | $6,152 | $87,800 | $39,200 | $48,600 |
| 2014 | $6,038 | $87,800 | $39,200 | $48,600 |
Source: Public Records
Map
Nearby Homes
- 209 Hamilton St
- 214 William St
- 104 Harrison Ave
- 310 Passaic Ave Unit 308
- 310 Passaic Ave Unit 301
- 308 Passaic Ave Unit 315
- 308-310 Passaic Ave
- 308-310 Passaic Ave Unit 215
- 308-310 Passaic Ave Unit 301
- 316 William St
- 319 William St
- 213 Central Ave
- 18 President St
- 323 William St
- 200 Dey St Unit 257
- 200 Dey St Unit 231
- 409 Hamilton St
- 527 N 3rd St
- 133 Sussex St
- 419 Hamilton St
Your Personal Tour Guide
Ask me questions while you tour the home.