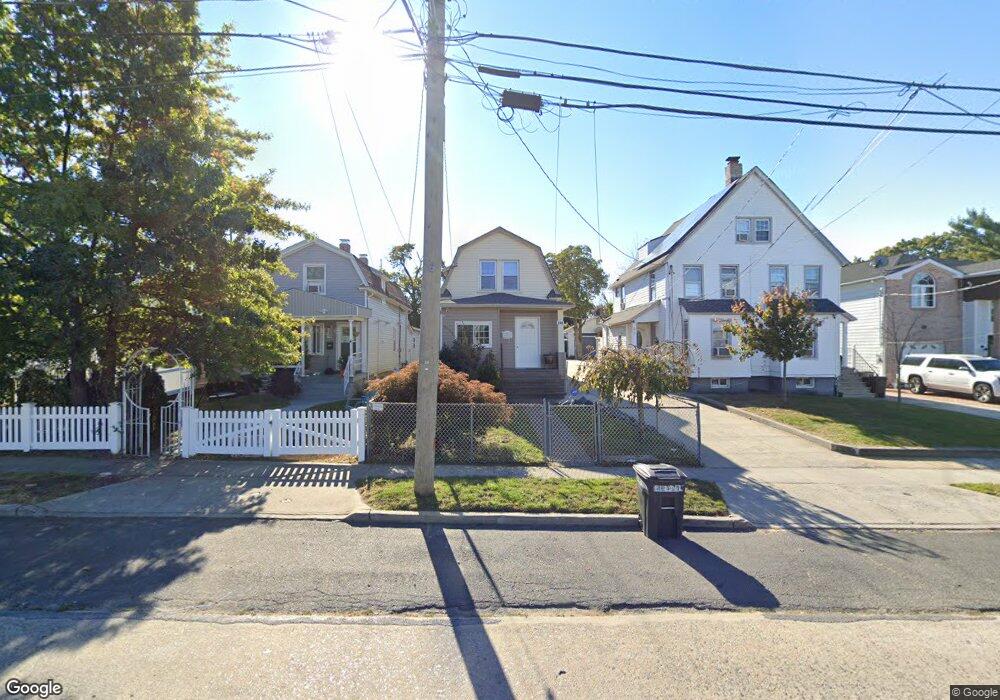
213 Prospect Ave Cedarhurst, NY 11516
Estimated Value: $674,344 - $754,000
Studio
1
Bath
1,184
Sq Ft
$603/Sq Ft
Est. Value
About This Home
This home is located at 213 Prospect Ave, Cedarhurst, NY 11516 and is currently estimated at $714,172, approximately $603 per square foot. 213 Prospect Ave is a home located in Nassau County with nearby schools including Lawrence Elementary School, Lawrence Primary School, and Lawrence Middle School.
Ownership History
Date
Name
Owned For
Owner Type
Purchase Details
Closed on
May 24, 2018
Sold by
Sandhu Tejpal Singh
Bought by
Nijjer Parm Partap
Current Estimated Value
Home Financials for this Owner
Home Financials are based on the most recent Mortgage that was taken out on this home.
Original Mortgage
$298,000
Outstanding Balance
$257,177
Interest Rate
4.5%
Mortgage Type
Adjustable Rate Mortgage/ARM
Estimated Equity
$456,995
Purchase Details
Closed on
Sep 8, 2016
Sold by
French Nancy
Bought by
Sandhu Tejpal Singh
Home Financials for this Owner
Home Financials are based on the most recent Mortgage that was taken out on this home.
Original Mortgage
$220,924
Interest Rate
3.45%
Mortgage Type
FHA
Purchase Details
Closed on
Oct 12, 2009
Sold by
Vasquez Vanessa L
Bought by
French Nancy
Purchase Details
Closed on
Aug 29, 2005
Sold by
Hendrickson John
Create a Home Valuation Report for This Property
The Home Valuation Report is an in-depth analysis detailing your home's value as well as a comparison with similar homes in the area
Home Values in the Area
Average Home Value in this Area
Purchase History
| Date | Buyer | Sale Price | Title Company |
|---|---|---|---|
| Nijjer Parm Partap | -- | Security Title | |
| Sandhu Tejpal Singh | $225,000 | Highland Title Insurance Age | |
| French Nancy | -- | -- | |
| -- | -- | -- |
Source: Public Records
Mortgage History
| Date | Status | Borrower | Loan Amount |
|---|---|---|---|
| Open | Nijjer Parm Partap | $298,000 | |
| Previous Owner | Sandhu Tejpal Singh | $220,924 |
Source: Public Records
Tax History
| Year | Tax Paid | Tax Assessment Tax Assessment Total Assessment is a certain percentage of the fair market value that is determined by local assessors to be the total taxable value of land and additions on the property. | Land | Improvement |
|---|---|---|---|---|
| 2025 | $7,390 | $526 | $247 | $279 |
| 2024 | $2,536 | $526 | $247 | $279 |
| 2023 | $7,136 | $526 | $247 | $279 |
| 2022 | $7,136 | $526 | $247 | $279 |
| 2021 | $9,691 | $515 | $242 | $273 |
| 2020 | $7,183 | $653 | $652 | $1 |
| 2019 | $2,098 | $653 | $652 | $1 |
| 2018 | $2,003 | $653 | $0 | $0 |
| 2017 | $1,219 | $653 | $652 | $1 |
| 2016 | $2,706 | $653 | $652 | $1 |
| 2015 | $1,429 | $653 | $652 | $1 |
| 2014 | $1,429 | $653 | $652 | $1 |
| 2013 | $1,318 | $653 | $652 | $1 |
Source: Public Records
Map
Nearby Homes
- 219 Pearsall Place
- 136 Linden St
- 761 W Broadway
- 770 W Broadway
- 257 Cedarhurst Ave Unit A10
- 279 Cedarhurst Ave Unit G-6
- 1 Meadow Dr Unit 3H-1
- 1 Meadow Dr Unit 3D
- 487 5th Ave
- 132 Park St
- 819 Broadway Unit 1-G
- 463 Summit Ave Unit 2F
- 461 5th Ave
- 508 Monroe St
- 409 Barnard Ave
- 467 W Broadway
- 4 Ivy St
- 569 Peninsula Blvd
- 141 Wyckoff Place Unit 6-E
- 141 Wyckoff Place Unit 1F
- 211 Prospect Ave
- 219 Prospect Ave
- 203 Prospect Ave
- 223 Prospect Ave
- 227 Prospect Ave
- 210 Grove Ave
- 214 Grove Ave
- 204 Grove Ave
- 231 Prospect Ave
- 220 Grove Ave
- 218 Prospect Ave
- 220 Prospect Ave
- 224 Prospect Ave
- 237 Prospect Ave
- 230 Grove Ave
- 141 Prospect Ave
- 683 Chestnut St
- 705 Althouse St
- 677 Chestnut St
- 228 Prospect Ave
Your Personal Tour Guide
Ask me questions while you tour the home.