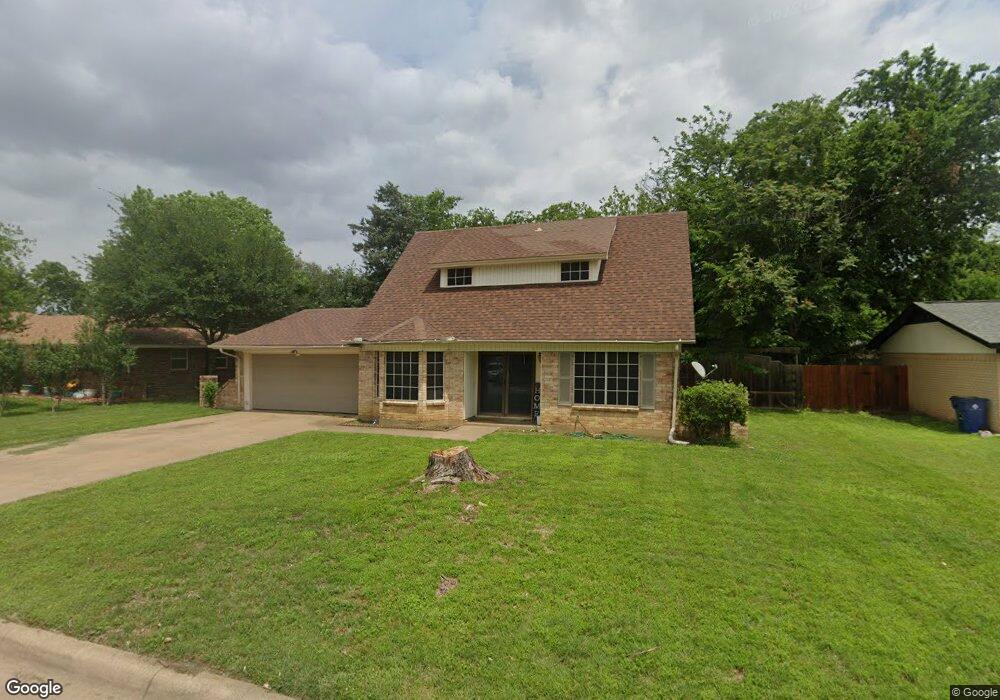
213 Smith St Burleson, TX 76028
Estimated Value: $251,000 - $278,000
3
Beds
2
Baths
1,464
Sq Ft
$181/Sq Ft
Est. Value
About This Home
This home is located at 213 Smith St, Burleson, TX 76028 and is currently estimated at $265,587, approximately $181 per square foot. 213 Smith St is a home located in Johnson County with nearby schools including Norwood Elementary School, Nick Kerr Middle School, and Burleson Centennial High School.
Ownership History
Date
Name
Owned For
Owner Type
Purchase Details
Closed on
Jan 7, 2021
Sold by
Echavarria Juan A and Echavarria Maria
Bought by
Gibson Lonna L and Sulak Michael Shawn
Current Estimated Value
Home Financials for this Owner
Home Financials are based on the most recent Mortgage that was taken out on this home.
Original Mortgage
$152,000
Outstanding Balance
$134,701
Interest Rate
2.7%
Mortgage Type
New Conventional
Estimated Equity
$130,886
Purchase Details
Closed on
Jun 15, 2012
Sold by
Dauphinot Tony and Minor Mark R
Bought by
Z Tech Holdings Llc
Home Financials for this Owner
Home Financials are based on the most recent Mortgage that was taken out on this home.
Original Mortgage
$317,000
Interest Rate
3.86%
Mortgage Type
Purchase Money Mortgage
Purchase Details
Closed on
Dec 14, 2005
Sold by
Aumuller Robert Williams
Bought by
Aumuller Lisa Kay
Create a Home Valuation Report for This Property
The Home Valuation Report is an in-depth analysis detailing your home's value as well as a comparison with similar homes in the area
Home Values in the Area
Average Home Value in this Area
Purchase History
| Date | Buyer | Sale Price | Title Company |
|---|---|---|---|
| Gibson Lonna L | -- | Fidelity National Title | |
| Z Tech Holdings Llc | -- | None Available | |
| Aumuller Lisa Kay | -- | None Available |
Source: Public Records
Mortgage History
| Date | Status | Borrower | Loan Amount |
|---|---|---|---|
| Open | Gibson Lonna L | $152,000 | |
| Previous Owner | Z Tech Holdings Llc | $317,000 |
Source: Public Records
Tax History
| Year | Tax Paid | Tax Assessment Tax Assessment Total Assessment is a certain percentage of the fair market value that is determined by local assessors to be the total taxable value of land and additions on the property. | Land | Improvement |
|---|---|---|---|---|
| 2025 | $6,474 | $281,835 | $35,000 | $246,835 |
| 2024 | $6,474 | $281,835 | $35,000 | $246,835 |
| 2023 | $6,412 | $281,835 | $35,000 | $246,835 |
| 2022 | $5,459 | $217,055 | $35,000 | $182,055 |
| 2021 | $4,333 | $166,632 | $34,000 | $132,632 |
| 2020 | $4,521 | $166,632 | $34,000 | $132,632 |
| 2019 | $4,688 | $162,949 | $34,000 | $128,949 |
| 2018 | $4,254 | $147,868 | $28,500 | $119,368 |
| 2017 | $3,412 | $124,783 | $26,000 | $98,783 |
| 2016 | $3,102 | $113,438 | $18,500 | $94,938 |
| 2015 | $1,308 | $83,532 | $18,500 | $65,032 |
| 2014 | $1,308 | $81,033 | $18,500 | $62,533 |
Source: Public Records
Map
Nearby Homes
- 240 Smith St
- 301 Bernice Ct
- 737 Ash St
- 417 Lena Ln
- 404 Nathan St
- 820 Ash St
- 600 Sue Ann Ln
- 705 SW Sunnybrook Dr
- 312 Gardenia Ct
- 729 SW Sunnybrook Dr
- 208 NW Summercrest Blvd
- 308 Jasmine Ct
- 301 Lena Ln
- 120 NW Wanda Way
- 2420 Wilshire Blvd
- 309 Sundown Ct
- 317 Boulder Ct
- 157 SE Tarrant Ave
- 125 NW Jill Ann Dr
- 318 Boulder Ct
Your Personal Tour Guide
Ask me questions while you tour the home.