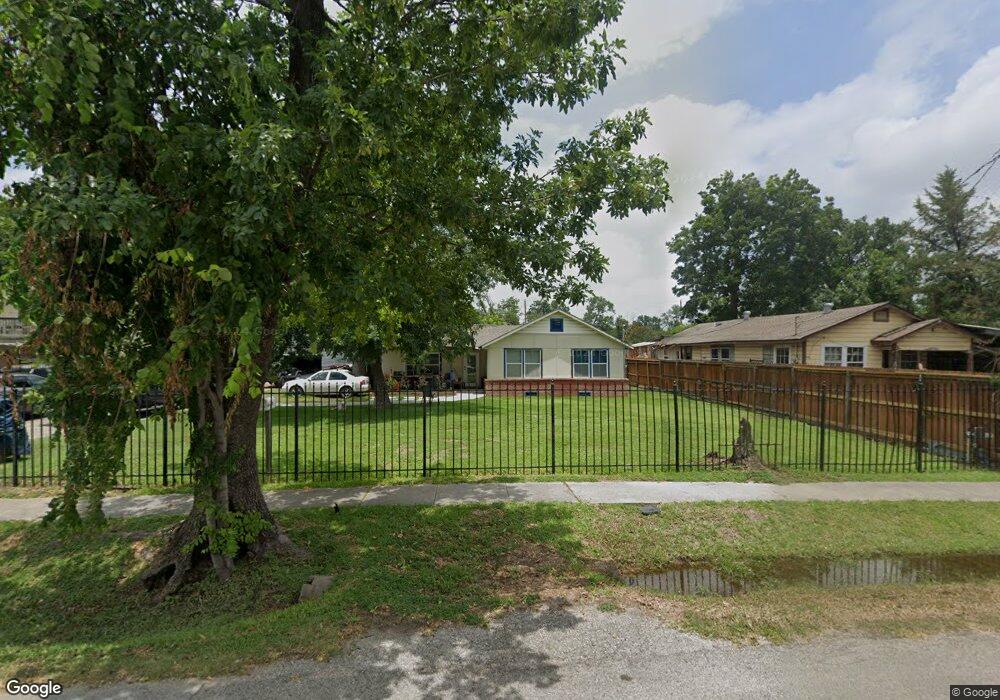
213 Van Molan St Houston, TX 77022
Northside-Northline NeighborhoodEstimated Value: $267,000 - $282,000
About This Home
This home is located at 213 Van Molan St, Houston, TX 77022 and is currently estimated at $274,064, approximately $174 per square foot. 213 Van Molan St is a home located in Harris County with nearby schools including Janowski Elementary School, Burbank Middle School, and Sam Houston Math, Science & Technology Center.
Ownership History
We collect this data history from publicly available records. To have your information removed, we recommend requesting removal directly through your county’s website.
Purchase Details
Home Financials for this Owner
Home Financials are based on the most recent Mortgage that was taken out on this home.Purchase Details
Purchase Details
Home Values in the Area
Average Home Value in this Area
Purchase History
We collect this data history from publicly available records. To have your information removed, we recommend requesting removal directly through your county’s website.
| Date | Buyer | Sale Price | Title Company |
|---|---|---|---|
| -- | Old Republic National Title | ||
| -- | None Available | ||
| -- | -- |
Mortgage History
We collect this data history from publicly available records. To have your information removed, we recommend requesting removal directly through your county’s website.
| Date | Status | Borrower | Loan Amount |
|---|---|---|---|
| Open | $125,000 | ||
| Closed | $0 |
Tax History
We collect this data history from publicly available records. To have your information removed, we recommend requesting removal directly through your county’s website.
| Year | Tax Paid | Tax Assessment Tax Assessment Total Assessment is a certain percentage of the fair market value that is determined by local assessors to be the total taxable value of land and additions on the property. | Land | Improvement |
|---|---|---|---|---|
| 2025 | $78 | $257,177 | $177,840 | $79,337 |
| 2024 | $594 | $241,151 | $163,215 | $77,936 |
| 2023 | $594 | $220,308 | $99,450 | $120,858 |
| 2022 | $3,671 | $194,319 | $99,450 | $94,869 |
| 2021 | $3,532 | $170,689 | $99,450 | $71,239 |
| 2020 | $3,337 | $161,711 | $99,450 | $62,261 |
| 2019 | $3,170 | $147,736 | $81,900 | $65,836 |
| 2018 | $2,015 | $121,403 | $68,445 | $52,958 |
| 2017 | $2,618 | $121,403 | $68,445 | $52,958 |
| 2016 | $2,380 | $116,088 | $64,350 | $51,738 |
| 2015 | $1,589 | $85,556 | $36,800 | $48,756 |
| 2014 | $1,589 | $85,556 | $36,800 | $48,756 |
Map
- 220 Palmyra St
- 210 Garrotsville St
- 0 E 31st St Unit 75519178
- 244 Deerfield St
- 0 (418) Van Molan St
- 246 Rebecca St
- 7523 Roswell St
- 243 Rebecca St Unit F
- 7317 Roswell St
- 241 Rebecca St Unit B
- 428 Van Molan St
- 238 Julia St Unit E
- 208 Oddo St
- 7012 Duan St
- 8010 Roswell St
- 7115 Roswell St
- 7823 Appleton St
- 0 Appleton St
- 7807 Melrose St
- 230 Wallace St
- 133 Van Molan St
- 125 Van Molan St
- 137 Van Molan St
- 139 Van Molan St
- 139 Van Molan St Unit B
- 204 Palmyra St
- 208 Palmyra St
- 210 Palmyra St
- 124 Palmyra St
- 212 Palmyra St
- 132 Van Molan St
- 117 Van Molan St
- 128 Van Molan St
- 126 Van Molan St
- 215 Van Molan St
- 210 Van Molan St
- 120 Palmyra St
- 120 Palmyra St
- 120 Van Molan St
- 212 Van Molan St
Ask me questions while you tour the home.