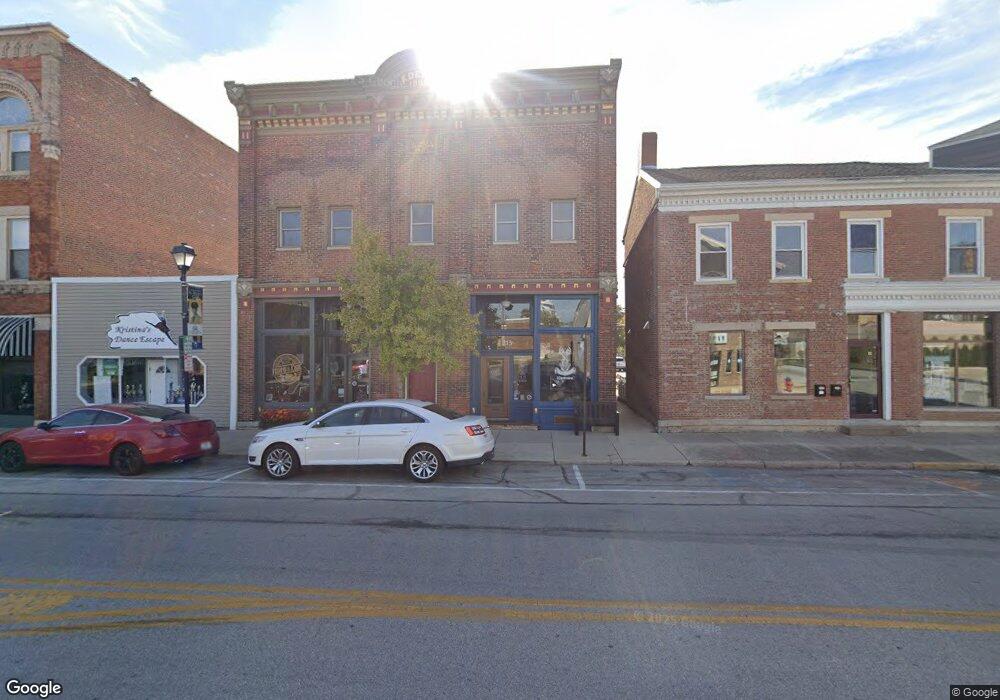
213 W Spring St Saint Marys, OH 45885
Estimated Value: $81,567
Studio
--
Bath
3,264
Sq Ft
$25/Sq Ft
Est. Value
About This Home
This home is located at 213 W Spring St, Saint Marys, OH 45885 and is currently estimated at $81,567, approximately $24 per square foot. 213 W Spring St is a home located in Auglaize County with nearby schools including St. Mary's West Intermediate School, St. Mary's East Primary School, and St. Marys Middle School.
Ownership History
Date
Name
Owned For
Owner Type
Purchase Details
Closed on
May 9, 2019
Sold by
Chivington Jeffrey S and Chivington Kelly B
Bought by
Black Dog Holdings Llc
Current Estimated Value
Purchase Details
Closed on
Apr 21, 1998
Sold by
Bruns Danny L and Bruns Mary E
Bought by
Chivington Jeffrey S
Purchase Details
Closed on
Mar 27, 1998
Sold by
Katterhenry Kevin R and Katterhenry Anna M
Bought by
Bruns Danny L and Bruns Mary E
Purchase Details
Closed on
Nov 1, 1987
Create a Home Valuation Report for This Property
The Home Valuation Report is an in-depth analysis detailing your home's value as well as a comparison with similar homes in the area
Home Values in the Area
Average Home Value in this Area
Purchase History
| Date | Buyer | Sale Price | Title Company |
|---|---|---|---|
| Black Dog Holdings Llc | $50,000 | None Available | |
| Chivington Jeffrey S | $36,000 | -- | |
| Bruns Danny L | $35,000 | -- | |
| -- | $65,000 | -- |
Source: Public Records
Tax History
| Year | Tax Paid | Tax Assessment Tax Assessment Total Assessment is a certain percentage of the fair market value that is determined by local assessors to be the total taxable value of land and additions on the property. | Land | Improvement |
|---|---|---|---|---|
| 2025 | $2,590 | $36,460 | $4,940 | $31,520 |
| 2024 | $2,590 | $36,460 | $4,940 | $31,520 |
| 2023 | $1,974 | $36,460 | $4,940 | $31,520 |
| 2022 | $2,185 | $36,040 | $5,540 | $30,500 |
| 2021 | $2,167 | $36,040 | $5,540 | $30,500 |
| 2020 | $1,095 | $36,040 | $5,537 | $30,503 |
| 2019 | $1,871 | $30,538 | $5,537 | $25,001 |
| 2018 | $1,870 | $30,538 | $5,537 | $25,001 |
| 2017 | $1,874 | $30,538 | $5,537 | $25,001 |
| 2016 | $1,691 | $27,146 | $5,299 | $21,847 |
| 2015 | $1,644 | $27,146 | $5,299 | $21,847 |
| 2014 | $1,635 | $27,146 | $5,299 | $21,847 |
| 2013 | $1,648 | $27,146 | $5,299 | $21,847 |
Source: Public Records
Map
Nearby Homes
Your Personal Tour Guide
Ask me questions while you tour the home.