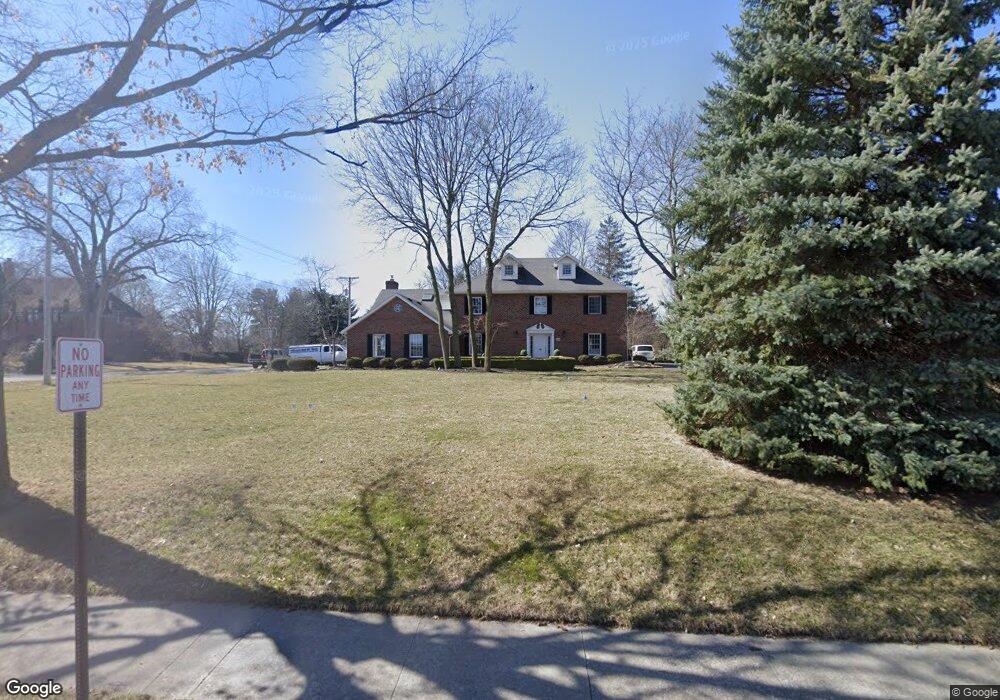
2132 S Main St Findlay, OH 45840
Estimated Value: $371,000 - $504,000
4
Beds
3
Baths
3,024
Sq Ft
$147/Sq Ft
Est. Value
About This Home
This home is located at 2132 S Main St, Findlay, OH 45840 and is currently estimated at $443,634, approximately $146 per square foot. 2132 S Main St is a home located in Hancock County with nearby schools including Chamberlin Hill Elementary School, Jefferson Elementary School, and Donnell Middle School.
Ownership History
Date
Name
Owned For
Owner Type
Purchase Details
Closed on
Dec 3, 2021
Sold by
Lause Thomas N and Lause Susan M
Bought by
Lause Thomas N and Lause Susan M
Current Estimated Value
Purchase Details
Closed on
Oct 2, 1992
Bought by
Lause Thomas N and Lause Susan M
Purchase Details
Closed on
Jul 24, 1989
Bought by
Sheaffer Jerry L & Anne Tr
Create a Home Valuation Report for This Property
The Home Valuation Report is an in-depth analysis detailing your home's value as well as a comparison with similar homes in the area
Home Values in the Area
Average Home Value in this Area
Purchase History
We collect this data history from publicly available records. To have your information removed, we recommend requesting removal directly through your county’s website.
| Date | Buyer | Sale Price | Title Company |
|---|---|---|---|
| Lause Thomas N | -- | None Available | |
| Lause Thomas N | $50,000 | -- | |
| Sheaffer Jerry L & Anne Tr | -- | -- |
Source: Public Records
Tax History
| Year | Tax Paid | Tax Assessment Tax Assessment Total Assessment is a certain percentage of the fair market value that is determined by local assessors to be the total taxable value of land and additions on the property. | Land | Improvement |
|---|---|---|---|---|
| 2024 | $4,739 | $133,390 | $12,290 | $121,100 |
| 2023 | $4,746 | $133,390 | $12,290 | $121,100 |
| 2022 | $4,730 | $133,390 | $12,290 | $121,100 |
| 2021 | $5,084 | $124,900 | $12,280 | $112,620 |
| 2020 | $5,084 | $124,900 | $12,280 | $112,620 |
| 2019 | $4,960 | $124,380 | $12,280 | $112,100 |
| 2018 | $4,703 | $108,160 | $10,680 | $97,480 |
| 2017 | $4,703 | $108,160 | $10,680 | $97,480 |
| 2016 | $4,616 | $108,160 | $10,680 | $97,480 |
| 2015 | $3,876 | $88,640 | $9,950 | $78,690 |
| 2014 | $3,876 | $88,640 | $9,950 | $78,690 |
| 2012 | $3,903 | $88,640 | $9,950 | $78,690 |
Source: Public Records
Map
Nearby Homes
- 136 E Hobart Ave
- 220 E Yates Ave
- 2118 S Lake Ct
- 1809 Park St
- 1730 Park St
- 400 E Pearl St
- 156 Marilyn Dr
- 3001 Goldenrod Ln
- 384 Marilyn Dr
- 206 Greenlawn Ave
- 1209 S Main St
- 1200 S Main St
- 2925 Goldenrod Ln
- 0 Viburnum Ct Unit 10002881
- 0 Viburnum Ct Unit 10002879
- 0 Viburnum Ct Unit 10002878
- 0 Viburnum Ct Unit 10002880
- 0 Virbunum Ct Unit 87 305267
- 1231 S Blanchard St
- 525 3rd St
- 2126 S Main St
- 2120 S Main St
- 113 W Hobart Ave
- 118 W Edgar Ave
- 2108 S Main St
- 117 W Hobart Ave
- 2200 S Main St
- 2117 S Main St
- 2131 S Main St
- 2036 S Main St
- 2101 S Main St
- 2032 S Main St
- 135 W Hobart Ave
- 2028 S Main St
- 116 W Hobart Ave
- 2203 S Main St
- 2216 S Main St
- 118 E Edgar Ave
- 122 W Hobart Ave
- 129 E Hobart Ave
Your Personal Tour Guide
Ask me questions while you tour the home.