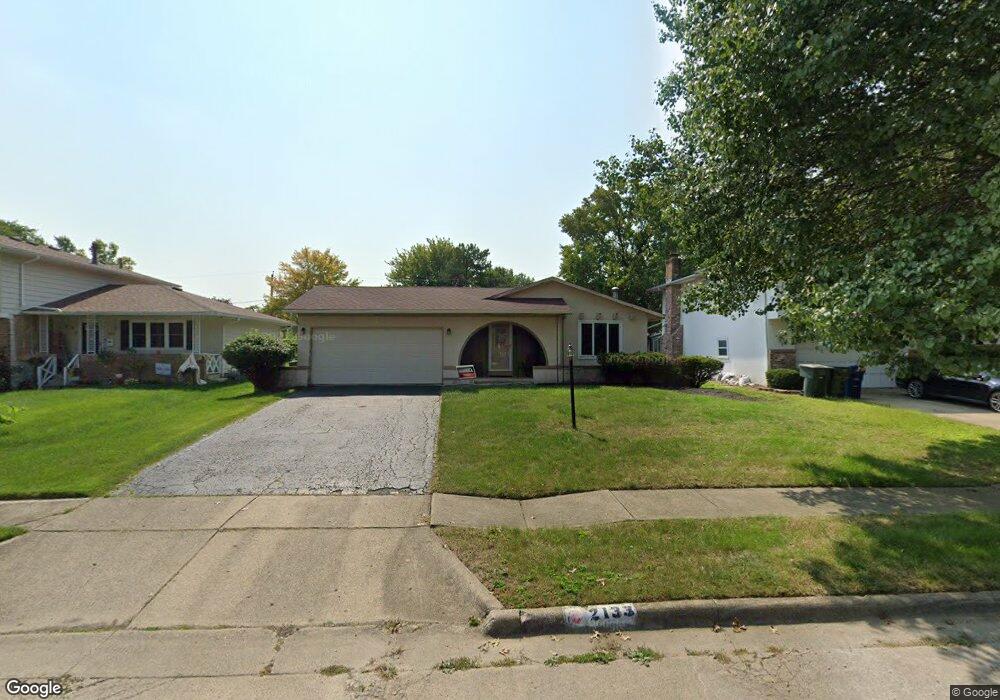
2133 Sumac Loop S Columbus, OH 43229
Forest Park East NeighborhoodEstimated Value: $265,000 - $303,000
3
Beds
3
Baths
1,186
Sq Ft
$238/Sq Ft
Est. Value
About This Home
This home is located at 2133 Sumac Loop S, Columbus, OH 43229 and is currently estimated at $282,755, approximately $238 per square foot. 2133 Sumac Loop S is a home located in Franklin County with nearby schools including Avalon Elementary School, Northgate Intermediate, and Woodward Park Middle School.
Ownership History
Date
Name
Owned For
Owner Type
Purchase Details
Closed on
Aug 28, 2002
Sold by
Chernauskas Shannon R
Bought by
Russell Jerry and Russell Tamberlyn D
Current Estimated Value
Home Financials for this Owner
Home Financials are based on the most recent Mortgage that was taken out on this home.
Original Mortgage
$124,000
Interest Rate
7.25%
Mortgage Type
Purchase Money Mortgage
Purchase Details
Closed on
Oct 8, 2001
Sold by
Chernauskas Jeffrey S
Bought by
Chernauskas Shannon R
Home Financials for this Owner
Home Financials are based on the most recent Mortgage that was taken out on this home.
Original Mortgage
$93,300
Interest Rate
6.92%
Purchase Details
Closed on
Nov 12, 1997
Sold by
Voit Frances A
Bought by
Chernauskas Jeffrey S and Chernauskas Shannon R
Home Financials for this Owner
Home Financials are based on the most recent Mortgage that was taken out on this home.
Original Mortgage
$86,912
Interest Rate
7.43%
Mortgage Type
FHA
Create a Home Valuation Report for This Property
The Home Valuation Report is an in-depth analysis detailing your home's value as well as a comparison with similar homes in the area
Home Values in the Area
Average Home Value in this Area
Purchase History
| Date | Buyer | Sale Price | Title Company |
|---|---|---|---|
| Russell Jerry | $124,000 | Chicago Title | |
| Chernauskas Shannon R | -- | Chicago Title | |
| Chernauskas Jeffrey S | $95,000 | Amerititle East |
Source: Public Records
Mortgage History
| Date | Status | Borrower | Loan Amount |
|---|---|---|---|
| Closed | Russell Jerry | $124,000 | |
| Closed | Chernauskas Shannon R | $93,300 | |
| Closed | Chernauskas Jeffrey S | $86,912 |
Source: Public Records
Tax History
| Year | Tax Paid | Tax Assessment Tax Assessment Total Assessment is a certain percentage of the fair market value that is determined by local assessors to be the total taxable value of land and additions on the property. | Land | Improvement |
|---|---|---|---|---|
| 2025 | $3,804 | $84,770 | $18,480 | $66,290 |
| 2024 | $3,804 | $84,770 | $18,480 | $66,290 |
| 2023 | $3,756 | $84,770 | $18,480 | $66,290 |
| 2022 | $3,103 | $59,820 | $11,800 | $48,020 |
| 2021 | $3,108 | $59,820 | $11,800 | $48,020 |
| 2020 | $3,112 | $59,820 | $11,800 | $48,020 |
| 2019 | $2,669 | $44,000 | $8,750 | $35,250 |
| 2018 | $2,528 | $44,000 | $8,750 | $35,250 |
| 2017 | $2,668 | $44,000 | $8,750 | $35,250 |
| 2016 | $2,636 | $39,800 | $8,230 | $31,570 |
| 2015 | $2,393 | $39,800 | $8,230 | $31,570 |
| 2014 | $2,399 | $39,800 | $8,230 | $31,570 |
| 2013 | $2,490 | $41,860 | $8,645 | $33,215 |
Source: Public Records
Map
Nearby Homes
- 2087 Teakwood Dr
- 5556 Parkshire Dr Unit 5556
- 5726 Beechcroft Rd Unit J
- 1862 Torchwood Dr
- 5732 Beechcroft Rd Unit B
- 5720 Beechcroft Rd Unit B
- 5486 Pine Bluff Rd
- 2251 Tuliptree Ave
- 5705 Pine Tree St S Unit F
- 1687 Brookfield Square S
- 5885 Beechcroft Rd Unit 306
- 5885 Beechcroft Rd Unit 114
- 5972 Maple Canyon Ave
- 1638 Arrowood Loop N
- 6019 Beechcroft Rd
- 5575 Karl Rd
- 1905 Denise Dr
- 2470 Carolina Ave Unit 66
- 1523 Hempwood Dr
- 4979 Lyle Rd
- 2125 Sumac Loop S
- 2141 Sumac Loop S
- 2117 Sumac Loop S
- 2149 Sumac Loop S
- 5426 Teakwood Ct
- 5422 Teakwood Ct
- 5430 Teakwood Ct
- 5418 Teakwood Ct
- 2136 Sumac Loop S
- 2107 Sumac Loop S
- 2126 Sumac Loop S
- 2159 Sumac Loop S
- 2144 Sumac Loop S
- 5414 Teakwood Ct
- 2118 Sumac Loop S
- 2095 Sumac Loop S
- 2154 Sumac Loop S
- 2095 Sumac Loop N
- 2106 Sumac Loop S
- 5434 Teakwood Ct
Your Personal Tour Guide
Ask me questions while you tour the home.