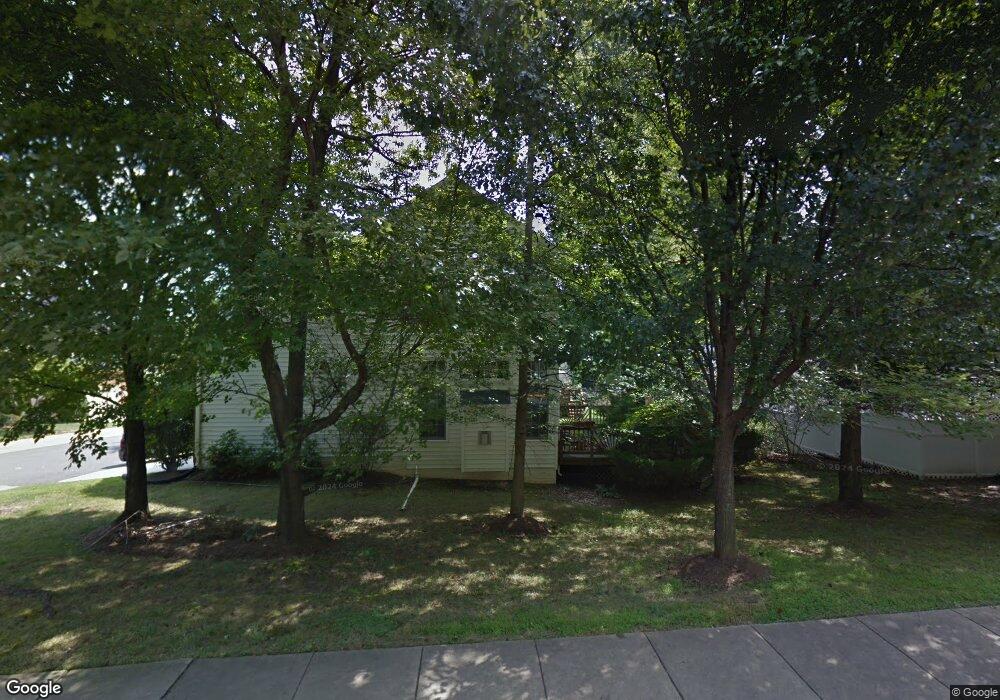
2135 Tysons Executive Ct Dunn Loring, VA 22027
Estimated Value: $1,409,000 - $1,456,000
5
Beds
5
Baths
3,742
Sq Ft
$382/Sq Ft
Est. Value
About This Home
This home is located at 2135 Tysons Executive Ct, Dunn Loring, VA 22027 and is currently estimated at $1,428,582, approximately $381 per square foot. 2135 Tysons Executive Ct is a home located in Fairfax County with nearby schools including Stenwood Elementary School, Kilmer Middle School, and Marshall High School.
Ownership History
Date
Name
Owned For
Owner Type
Purchase Details
Closed on
Aug 26, 1997
Sold by
Nvr Homes Inc
Bought by
Sharma Arun K and Sharma Renu
Current Estimated Value
Home Financials for this Owner
Home Financials are based on the most recent Mortgage that was taken out on this home.
Original Mortgage
$325,000
Outstanding Balance
$50,145
Interest Rate
7.42%
Mortgage Type
New Conventional
Estimated Equity
$1,378,437
Create a Home Valuation Report for This Property
The Home Valuation Report is an in-depth analysis detailing your home's value as well as a comparison with similar homes in the area
Home Values in the Area
Average Home Value in this Area
Purchase History
We collect this data history from publicly available records. To have your information removed, we recommend requesting removal directly through your county’s website.
| Date | Buyer | Sale Price | Title Company |
|---|---|---|---|
| Sharma Arun K | $446,680 | -- |
Source: Public Records
Mortgage History
We collect this data history from publicly available records. To have your information removed, we recommend requesting removal directly through your county’s website.
| Date | Status | Borrower | Loan Amount |
|---|---|---|---|
| Open | Sharma Arun K | $325,000 |
Source: Public Records
Tax History
| Year | Tax Paid | Tax Assessment Tax Assessment Total Assessment is a certain percentage of the fair market value that is determined by local assessors to be the total taxable value of land and additions on the property. | Land | Improvement |
|---|---|---|---|---|
| 2025 | $14,768 | $1,302,610 | $419,000 | $883,610 |
| 2024 | $14,768 | $1,274,790 | $409,000 | $865,790 |
| 2023 | $14,239 | $1,261,730 | $409,000 | $852,730 |
| 2022 | $13,506 | $1,181,100 | $399,000 | $782,100 |
| 2021 | $11,939 | $1,017,400 | $379,000 | $638,400 |
| 2020 | $11,926 | $1,007,670 | $379,000 | $628,670 |
| 2019 | $12,226 | $1,033,000 | $379,000 | $654,000 |
| 2018 | $11,592 | $1,008,000 | $354,000 | $654,000 |
| 2017 | $11,297 | $973,000 | $319,000 | $654,000 |
| 2016 | $11,588 | $1,000,250 | $319,000 | $681,250 |
| 2015 | $10,902 | $976,890 | $309,000 | $667,890 |
| 2014 | $10,766 | $966,890 | $299,000 | $667,890 |
Source: Public Records
Map
Nearby Homes
- 2181 Sandburg St
- 2230 George C Marshall Dr Unit 712
- 2230 George C Marshall Dr Unit 806
- 2230 George C Marshall Dr Unit 512
- 2230 George C Marshall Dr Unit 924
- 2178 Harithy Dr
- 7914 Tyson Oaks Cir
- 8046 Reserve Way
- 7914 Idylwood Rd
- 2040 Tysons Ridgeline Rd
- 8229 Bell Ln
- 2373 Whitestone Hill Ct
- 2014 Edgar Ct
- 2300 Pimmit Dr Unit 608
- 2300 Pimmit Dr Unit 713
- 2300 Pimmit Dr Unit 418
- 2100 Hutchison Grove Ct
- 2106 Tysons Ridgeline Rd
- 2323 Sawtooth Oak Ct
- 0 Madrillon Rd
- 2205 Sandburg St
- 2203-C Sandburg St
- 2203-B Sandburg St
- 7895 Pearl Fog Way
- 7893 Pearl Fog Way
- 2143 Tysons Executive Ct
- 7891 Pearl Fog Way
- 2141 Tysons Executive Ct
- 2203B Sandburg St
- 2203 Sandburg St
- 2203A Sandburg St
- 2203A Sandburg St
- 2212 Sandburg St
- 2145 Tysons Executive Ct
- 2139 Tysons Executive Ct
- 2214 Sandburg St
- 2209 Sandburg St
- 2137 Tysons Executive Ct
- 2183 Sandburg St
- 7890 Galesburg Place
Your Personal Tour Guide
Ask me questions while you tour the home.