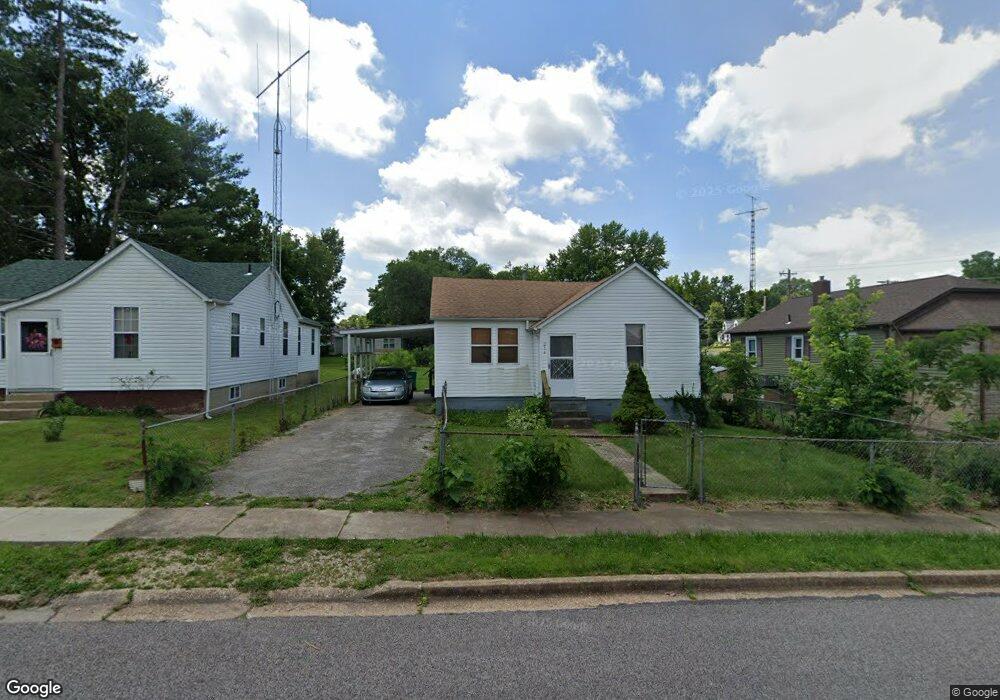
214 Sewell St Sullivan, MO 63080
Estimated Value: $118,000 - $145,000
2
Beds
1
Bath
982
Sq Ft
$131/Sq Ft
Est. Value
About This Home
This home is located at 214 Sewell St, Sullivan, MO 63080 and is currently estimated at $129,112, approximately $131 per square foot. 214 Sewell St is a home located in Franklin County with nearby schools including Sullivan Primary School, Sullivan Elementary School, and Sullivan Middle School.
Ownership History
Date
Name
Owned For
Owner Type
Purchase Details
Closed on
Oct 20, 2006
Sold by
Centunzi Michael S and Centunzi Kari L
Bought by
Heath Susan M and Heath Wilbur E
Current Estimated Value
Purchase Details
Closed on
Jan 20, 2005
Sold by
Busch Jeffrey E and Busch Catherine A
Bought by
Centunzi Michael S and Centunzi Kari L
Home Financials for this Owner
Home Financials are based on the most recent Mortgage that was taken out on this home.
Original Mortgage
$52,181
Interest Rate
5.68%
Mortgage Type
FHA
Create a Home Valuation Report for This Property
The Home Valuation Report is an in-depth analysis detailing your home's value as well as a comparison with similar homes in the area
Home Values in the Area
Average Home Value in this Area
Purchase History
We collect this data history from publicly available records. To have your information removed, we recommend requesting removal directly through your county’s website.
| Date | Buyer | Sale Price | Title Company |
|---|---|---|---|
| Heath Susan M | -- | None Available | |
| Centunzi Michael S | -- | None Available |
Source: Public Records
Mortgage History
We collect this data history from publicly available records. To have your information removed, we recommend requesting removal directly through your county’s website.
| Date | Status | Borrower | Loan Amount |
|---|---|---|---|
| Previous Owner | Centunzi Michael S | $52,181 |
Source: Public Records
Tax History
| Year | Tax Paid | Tax Assessment Tax Assessment Total Assessment is a certain percentage of the fair market value that is determined by local assessors to be the total taxable value of land and additions on the property. | Land | Improvement |
|---|---|---|---|---|
| 2025 | $908 | $14,664 | $0 | $0 |
| 2024 | $908 | $13,659 | $0 | $0 |
| 2023 | $794 | $13,659 | $0 | $0 |
| 2022 | $709 | $12,230 | $0 | $0 |
| 2021 | $713 | $12,230 | $0 | $0 |
| 2020 | $662 | $11,132 | $0 | $0 |
| 2019 | $662 | $11,132 | $0 | $0 |
| 2018 | $630 | $10,450 | $0 | $0 |
| 2017 | $635 | $10,450 | $0 | $0 |
| 2016 | $620 | $10,323 | $0 | $0 |
| 2015 | $622 | $10,323 | $0 | $0 |
| 2014 | $610 | $10,442 | $0 | $0 |
Source: Public Records
Map
Nearby Homes
- 128 Grigsby St
- 111 E Vine St
- 329 Watson Rd
- 4 Grigsby St
- 318 E Euclid Ave
- 132 Virginia St
- 10 E Euclid Ave
- 206 N Church St
- 2 Maple St
- 222 Miller St
- 145 Oak St
- 719 Elizabeth St
- 656A Watson Rd
- 112 Orchard St
- 549 N Mansion St
- 18 Golf Dr
- 224 N Park St
- 0 Grandview
- 0 N Service Rd W Unit Lot WP001
- 306 Elmont Rd
Your Personal Tour Guide
Ask me questions while you tour the home.