2145 Ward Rd Columbus, OH 43224
North Linden NeighborhoodEstimated Value: $179,831 - $223,000
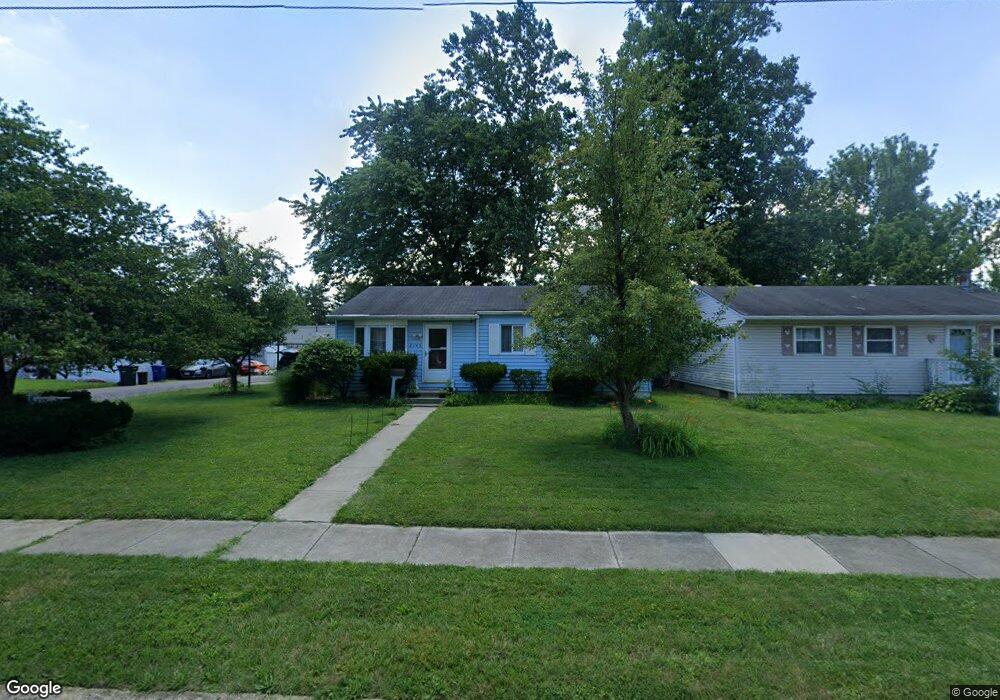
About This Home
This home is located at 2145 Ward Rd, Columbus, OH 43224 and is currently estimated at $195,708, approximately $209 per square foot. 2145 Ward Rd is a home located in Franklin County with nearby schools including North Linden Elementary School, Medina Middle School, and Mifflin High School.
Ownership History
We collect this data history from publicly available records. To have your information removed, we recommend requesting removal directly through your county’s website.
Purchase Details
Home Financials for this Owner
Home Financials are based on the most recent Mortgage that was taken out on this home.Purchase Details
Purchase Details
Home Values in the Area
Average Home Value in this Area
Purchase History
We collect this data history from publicly available records. To have your information removed, we recommend requesting removal directly through your county’s website.
| Date | Buyer | Sale Price | Title Company |
|---|---|---|---|
| $79,900 | Talon Group | ||
| -- | None Available | ||
| -- | -- |
Mortgage History
We collect this data history from publicly available records. To have your information removed, we recommend requesting removal directly through your county’s website.
| Date | Status | Borrower | Loan Amount |
|---|---|---|---|
| Open | $79,274 |
Tax History
We collect this data history from publicly available records. To have your information removed, we recommend requesting removal directly through your county’s website.
| Year | Tax Paid | Tax Assessment Tax Assessment Total Assessment is a certain percentage of the fair market value that is determined by local assessors to be the total taxable value of land and additions on the property. | Land | Improvement |
|---|---|---|---|---|
| 2025 | $2,366 | $52,710 | $10,570 | $42,140 |
| 2024 | $2,366 | $52,710 | $10,570 | $42,140 |
| 2023 | $2,335 | $52,710 | $10,570 | $42,140 |
| 2022 | $1,431 | $27,590 | $6,410 | $21,180 |
| 2021 | $1,433 | $27,590 | $6,410 | $21,180 |
| 2020 | $1,435 | $27,590 | $6,410 | $21,180 |
| 2019 | $1,333 | $21,980 | $5,110 | $16,870 |
| 2018 | $1,339 | $21,980 | $5,110 | $16,870 |
| 2017 | $1,409 | $21,980 | $5,110 | $16,870 |
| 2016 | $1,485 | $22,410 | $4,800 | $17,610 |
| 2015 | $1,348 | $22,410 | $4,800 | $17,610 |
| 2014 | $1,351 | $22,410 | $4,800 | $17,610 |
| 2013 | $740 | $24,885 | $5,320 | $19,565 |
Map
- 2195 Ferris Rd
- 2201 Ferris Rd
- 2034 Ferris Rd
- 2173 Sale Rd
- 2220 Sale Rd
- 2025 Sale Rd
- 2164 Fenton St
- 2255 Fenton St
- 2083 Ormond Ave
- 2304 Ashley Dr
- 2094 Radnor Ave
- 1919 Ward Rd
- 2235 Belcher Dr
- 1885 Case Rd
- 2344 Belcher Dr
- 1856 Lehner Rd
- 2010 Melrose Ave
- 1766 Ferris Rd
- 2529 Ferris Park Dr S
- 3750 Dresden St
Ask me questions while you tour the home.