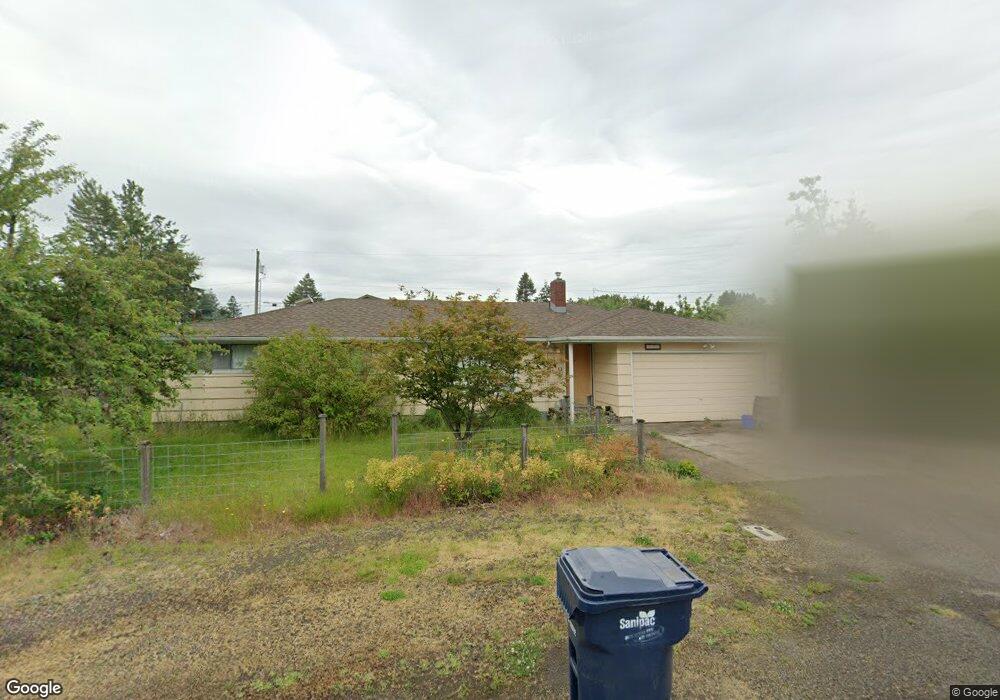
2153 Lamar Ln Eugene, OR 97401
Cal Young NeighborhoodEstimated Value: $441,027 - $489,000
3
Beds
2
Baths
1,372
Sq Ft
$335/Sq Ft
Est. Value
About This Home
This home is located at 2153 Lamar Ln, Eugene, OR 97401 and is currently estimated at $459,507, approximately $334 per square foot. 2153 Lamar Ln is a home located in Lane County with nearby schools including Willagillespie Elementary School, Monroe Middle School, and Sheldon High School.
Ownership History
Date
Name
Owned For
Owner Type
Purchase Details
Closed on
Nov 16, 2010
Sold by
Simons Cary L and Simons Cary M
Bought by
Simons Cary M and Simons Holly M
Current Estimated Value
Home Financials for this Owner
Home Financials are based on the most recent Mortgage that was taken out on this home.
Original Mortgage
$198,500
Outstanding Balance
$129,717
Interest Rate
4.16%
Mortgage Type
New Conventional
Estimated Equity
$329,790
Purchase Details
Closed on
May 27, 2004
Sold by
Roop Price H and Roop Dorothy L
Bought by
Simons Cary L
Home Financials for this Owner
Home Financials are based on the most recent Mortgage that was taken out on this home.
Original Mortgage
$132,000
Interest Rate
5.92%
Mortgage Type
Purchase Money Mortgage
Create a Home Valuation Report for This Property
The Home Valuation Report is an in-depth analysis detailing your home's value as well as a comparison with similar homes in the area
Home Values in the Area
Average Home Value in this Area
Purchase History
| Date | Buyer | Sale Price | Title Company |
|---|---|---|---|
| Simons Cary M | -- | Fidelity National Title Insu | |
| Simons Cary L | $165,000 | Fidelity National Title Insu |
Source: Public Records
Mortgage History
| Date | Status | Borrower | Loan Amount |
|---|---|---|---|
| Open | Simons Cary M | $198,500 | |
| Closed | Simons Cary L | $132,000 | |
| Closed | Simons Cary L | $33,000 |
Source: Public Records
Tax History
| Year | Tax Paid | Tax Assessment Tax Assessment Total Assessment is a certain percentage of the fair market value that is determined by local assessors to be the total taxable value of land and additions on the property. | Land | Improvement |
|---|---|---|---|---|
| 2025 | $4,102 | $210,539 | -- | -- |
| 2024 | $4,051 | $204,407 | -- | -- |
| 2023 | $4,051 | $198,454 | $0 | $0 |
| 2022 | $3,795 | $192,674 | $0 | $0 |
| 2021 | $3,565 | $187,063 | $0 | $0 |
| 2020 | $3,577 | $181,615 | $0 | $0 |
| 2019 | $3,455 | $176,326 | $0 | $0 |
| 2018 | $3,252 | $166,205 | $0 | $0 |
| 2017 | $3,106 | $166,205 | $0 | $0 |
| 2016 | $3,029 | $161,364 | $0 | $0 |
| 2015 | $2,942 | $156,664 | $0 | $0 |
| 2014 | $2,857 | $152,101 | $0 | $0 |
Source: Public Records
Map
Nearby Homes
- 1521 Gilham Rd
- 1943 Monterey Ln
- 1810 Minda Dr
- 0 Cal Young Rd Unit Lot 4
- 2495 Jeppesen Acres Rd
- 1625 Monterey Ln
- 1500 Norkenzie Rd Unit 12
- 2132 Willona Dr
- 2134 Willona Dr
- 1328 Spyglass Dr
- 2207 Willona Dr
- 2291 Norkenzie Rd
- 2580 Elysium Ave
- 1090 Corydon St
- 2420 Willona Dr
- 2577 Elysium Ave
- 982 Shaughnessy Ln
- 820 Lariat Dr
- 1332 Jeppesen Ave
- 0 Piper Ln Unit Lot 1
Your Personal Tour Guide
Ask me questions while you tour the home.