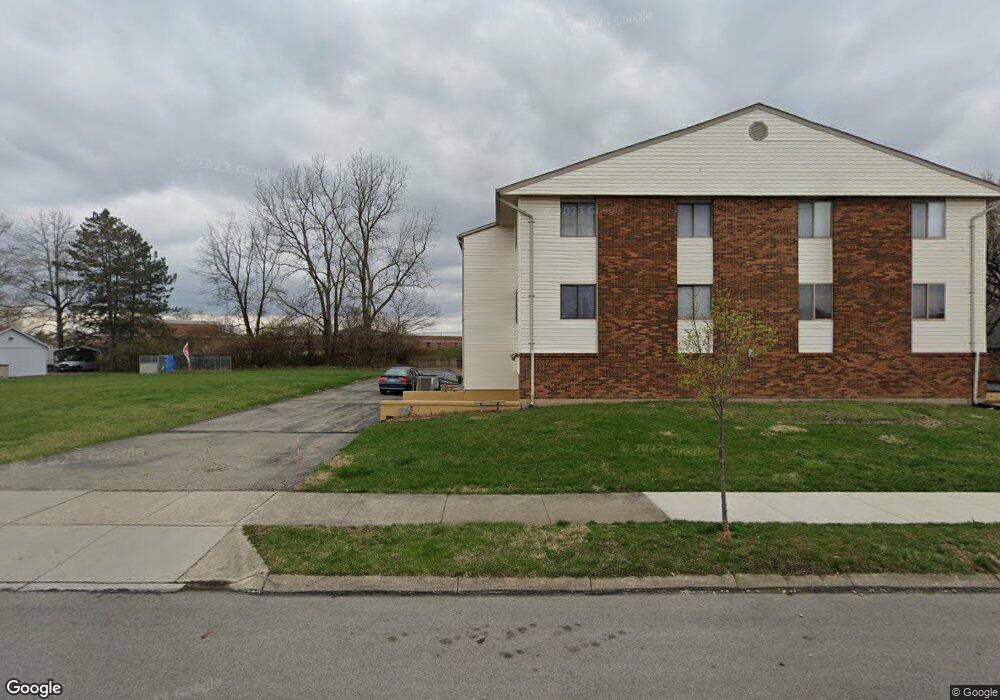
2155 Olympic St Unit 2155 Springfield, OH 45503
Estimated Value: $89,000 - $119,000
2
Beds
2
Baths
1,200
Sq Ft
$92/Sq Ft
Est. Value
About This Home
This home is located at 2155 Olympic St Unit 2155, Springfield, OH 45503 and is currently estimated at $110,097, approximately $91 per square foot. 2155 Olympic St Unit 2155 is a home located in Clark County with nearby schools including Kenton Elementary School, Roosevelt Middle School, and Springfield High School.
Ownership History
Date
Name
Owned For
Owner Type
Purchase Details
Closed on
Aug 24, 2011
Sold by
Fannie Mae
Bought by
Parke Brent W
Current Estimated Value
Home Financials for this Owner
Home Financials are based on the most recent Mortgage that was taken out on this home.
Original Mortgage
$62,400
Interest Rate
4.14%
Mortgage Type
New Conventional
Purchase Details
Closed on
May 16, 2011
Sold by
Lyons Deborah
Bought by
Federal National Mortgage Association
Purchase Details
Closed on
Sep 18, 2002
Sold by
Irvine Charles
Bought by
Lyons Deborah
Home Financials for this Owner
Home Financials are based on the most recent Mortgage that was taken out on this home.
Original Mortgage
$56,250
Interest Rate
6.4%
Purchase Details
Closed on
May 17, 2000
Sold by
Mcguff Mary L and Mcguff Eugene
Bought by
Henriksen Victoria A
Home Financials for this Owner
Home Financials are based on the most recent Mortgage that was taken out on this home.
Original Mortgage
$69,840
Interest Rate
8.21%
Create a Home Valuation Report for This Property
The Home Valuation Report is an in-depth analysis detailing your home's value as well as a comparison with similar homes in the area
Home Values in the Area
Average Home Value in this Area
Purchase History
| Date | Buyer | Sale Price | Title Company |
|---|---|---|---|
| Parke Brent W | $40,000 | Ohio Title Corp | |
| Federal National Mortgage Association | $33,400 | Attorney | |
| Lyons Deborah | $75,000 | -- | |
| Henriksen Victoria A | $72,000 | -- |
Source: Public Records
Mortgage History
| Date | Status | Borrower | Loan Amount |
|---|---|---|---|
| Previous Owner | Parke Brent W | $62,400 | |
| Previous Owner | Lyons Deborah | $56,250 | |
| Previous Owner | Henriksen Victoria A | $69,840 |
Source: Public Records
Tax History
| Year | Tax Paid | Tax Assessment Tax Assessment Total Assessment is a certain percentage of the fair market value that is determined by local assessors to be the total taxable value of land and additions on the property. | Land | Improvement |
|---|---|---|---|---|
| 2025 | $1,179 | $39,320 | $4,900 | $34,420 |
| 2024 | $1,149 | $23,270 | $4,200 | $19,070 |
| 2023 | $1,149 | $23,270 | $4,200 | $19,070 |
| 2022 | $1,286 | $23,270 | $4,200 | $19,070 |
| 2021 | $1,286 | $23,400 | $3,500 | $19,900 |
| 2020 | $1,289 | $23,400 | $3,500 | $19,900 |
| 2019 | $1,292 | $23,400 | $3,500 | $19,900 |
| 2018 | $1,306 | $22,710 | $3,500 | $19,210 |
| 2017 | $1,305 | $22,687 | $3,500 | $19,187 |
| 2016 | $1,307 | $22,687 | $3,500 | $19,187 |
| 2015 | $1,378 | $22,687 | $3,500 | $19,187 |
| 2014 | $1,372 | $22,687 | $3,500 | $19,187 |
| 2013 | $1,357 | $22,687 | $3,500 | $19,187 |
Source: Public Records
Map
Nearby Homes
- 2153 Olympic St Unit 2153
- 1315 Greystone Dr
- 1323 Greystone Dr
- 2439 Greystone Ln
- 2524 Home Orchard Dr
- 2442 Greystone Ln
- 1628 Yorkshire Ct
- 2553 Derr Rd
- 1535 Winding Trail
- 1718 Northpoint Rd
- 2824 Balsam Dr
- 1404 Attleboro Ave
- 1810 N Limestone St
- 1806 N Limestone St
- 141 S Kensington Place
- 329 Roosevelt Dr
- 154 Floral Ave
- 1710 Mitchell Blvd
- 1811 Devon Dr
- 1705 Magnolia Blvd
- 2157 Olympic St
- 2161 Olympic St Unit 2161
- 2159 Olympic St
- 2159 Olympic St
- 2159 Olympic St
- 2159 Olympic St
- 2163 Olympic St Unit 2163
- 2151 Olympic St Unit 2151
- 2151 Olympic St
- 2165 Olympic St
- 2165 Olympic St
- 2121 Olympic St Unit 2121
- 2119 Olympic St Unit 2119
- 2154 Olympic St
- 2156 Olympic St Unit 2156
- 2156 Olympic St
- 2117 Olympic St
- 2117 Olympic St Unit 2117
- 2117 Olympic St
- 2115 Olympic St Unit 2215
Your Personal Tour Guide
Ask me questions while you tour the home.