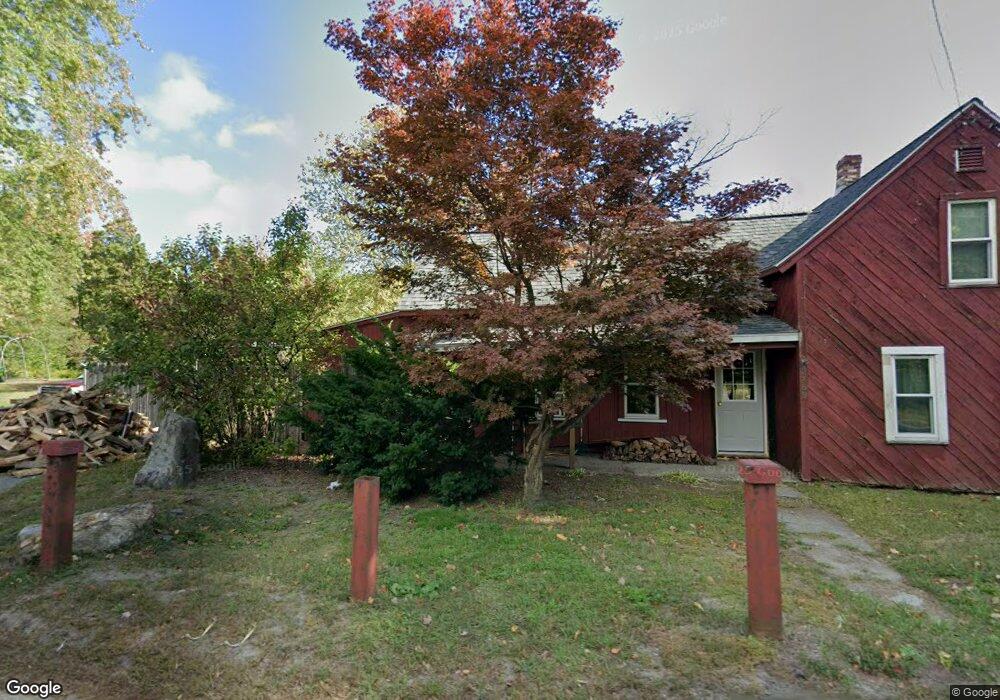
2159 Main St Lancaster, MA 01523
Estimated Value: $371,000 - $442,000
About This Home
This home is located at 2159 Main St, Lancaster, MA 01523 and is currently estimated at $412,856, approximately $279 per square foot. 2159 Main St is a home located in Worcester County with nearby schools including Mary Rowlandson Elementary School, Luther Burbank Middle School, and Nashoba Regional High School.
Ownership History
We collect this data history from publicly available records. To have your information removed, we recommend requesting removal directly through your county’s website.
Purchase Details
Home Financials for this Owner
Home Financials are based on the most recent Mortgage that was taken out on this home.Purchase Details
Home Financials for this Owner
Home Financials are based on the most recent Mortgage that was taken out on this home.Home Values in the Area
Average Home Value in this Area
Purchase History
We collect this data history from publicly available records. To have your information removed, we recommend requesting removal directly through your county’s website.
| Date | Buyer | Sale Price | Title Company |
|---|---|---|---|
| -- | -- | ||
| $135,000 | -- |
Mortgage History
We collect this data history from publicly available records. To have your information removed, we recommend requesting removal directly through your county’s website.
| Date | Status | Borrower | Loan Amount |
|---|---|---|---|
| Open | $180,000 | ||
| Previous Owner | $41,000 | ||
| Previous Owner | $133,500 | ||
| Previous Owner | $121,500 |
Tax History
We collect this data history from publicly available records. To have your information removed, we recommend requesting removal directly through your county’s website.
| Year | Tax Paid | Tax Assessment Tax Assessment Total Assessment is a certain percentage of the fair market value that is determined by local assessors to be the total taxable value of land and additions on the property. | Land | Improvement |
|---|---|---|---|---|
| 2025 | $4,769 | $295,100 | $130,200 | $164,900 |
| 2024 | $5,077 | $290,800 | $120,200 | $170,600 |
| 2023 | $0 | $263,800 | $110,200 | $153,600 |
| 2022 | $4,452 | $228,900 | $100,400 | $128,500 |
| 2021 | $4,314 | $215,900 | $100,400 | $115,500 |
| 2020 | $4,282 | $215,700 | $100,400 | $115,300 |
| 2019 | $4,130 | $209,100 | $100,400 | $108,700 |
| 2018 | $4,038 | $202,100 | $100,400 | $101,700 |
| 2016 | $3,758 | $192,200 | $99,400 | $92,800 |
| 2015 | $3,598 | $191,800 | $99,400 | $92,400 |
| 2014 | $3,513 | $185,800 | $99,400 | $86,400 |
Map
- 303 Ponakin Rd
- 1334 N Main St
- 1497 Lunenburg Rd
- 35 Mcgovern Blvd
- 16 Gates Crossing Unit 16
- 503 Hilltop Rd
- 0 Main St
- 11 Sycamore Dr
- 28 Willard St
- 32 Indian Ridge Dr
- 57 Seven Bridge Rd
- 15 Highfield Dr
- 32-50 Flanagan Hill Rd
- 26 Caspian Way
- 144 Seven Bridge Rd
- 7 Lawson Ave
- 555 Neck Rd
- 42 Fuller Ave
- 65 Fire Road 7
- 1237 Central St
Ask me questions while you tour the home.