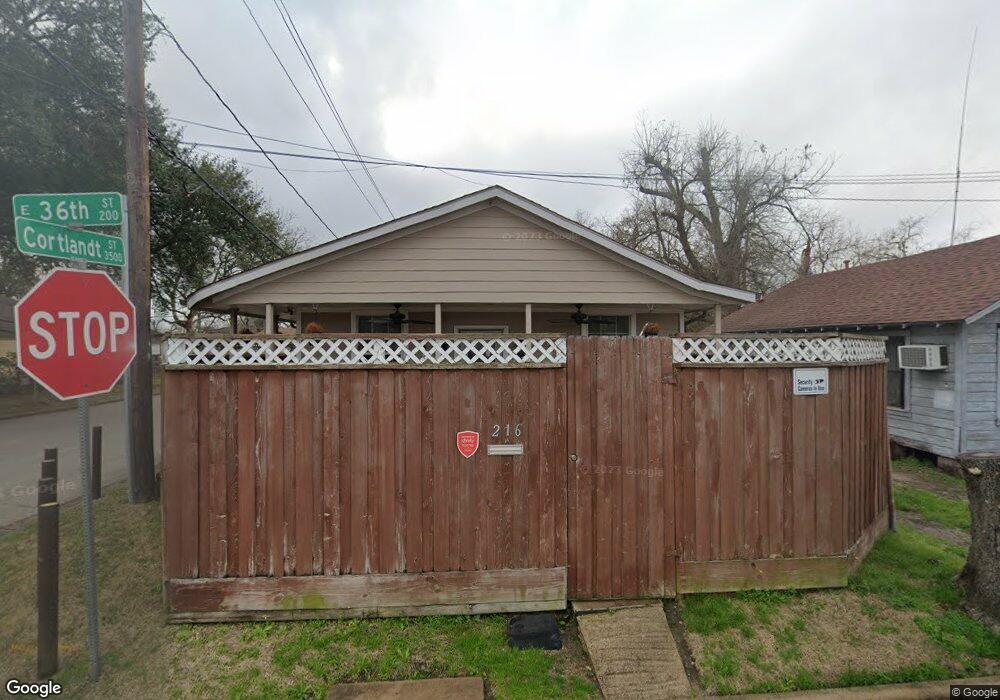
216 E 36th St Houston, TX 77018
Independence Heights NeighborhoodEstimated Value: $172,564 - $343,000
3
Beds
3
Baths
1,633
Sq Ft
$164/Sq Ft
Est. Value
About This Home
This home is located at 216 E 36th St, Houston, TX 77018 and is currently estimated at $267,521, approximately $163 per square foot. 216 E 36th St is a home located in Harris County with nearby schools including Burrus Elementary School, Hamilton Middle, and Booker T Washington Sr High.
Ownership History
Date
Name
Owned For
Owner Type
Purchase Details
Closed on
May 6, 2014
Sold by
Duncan Anthony
Bought by
Duncan Anthony and Duncan Renee Graham
Current Estimated Value
Purchase Details
Closed on
Jan 4, 1999
Sold by
Hill Gary and Horton Star L
Bought by
Morena Eduardo Dela
Home Financials for this Owner
Home Financials are based on the most recent Mortgage that was taken out on this home.
Original Mortgage
$66,450
Interest Rate
6.99%
Mortgage Type
FHA
Purchase Details
Closed on
Sep 26, 1997
Sold by
Thomas Charles
Bought by
Duncan Anthony and Duncan Renee
Create a Home Valuation Report for This Property
The Home Valuation Report is an in-depth analysis detailing your home's value as well as a comparison with similar homes in the area
Home Values in the Area
Average Home Value in this Area
Purchase History
We collect this data history from publicly available records. To have your information removed, we recommend requesting removal directly through your county’s website.
| Date | Buyer | Sale Price | Title Company |
|---|---|---|---|
| Duncan Anthony | -- | None Available | |
| Morena Eduardo Dela | -- | Chicago Title | |
| Duncan Anthony | -- | -- |
Source: Public Records
Mortgage History
We collect this data history from publicly available records. To have your information removed, we recommend requesting removal directly through your county’s website.
| Date | Status | Borrower | Loan Amount |
|---|---|---|---|
| Previous Owner | Morena Eduardo Dela | $66,450 |
Source: Public Records
Tax History
| Year | Tax Paid | Tax Assessment Tax Assessment Total Assessment is a certain percentage of the fair market value that is determined by local assessors to be the total taxable value of land and additions on the property. | Land | Improvement |
|---|---|---|---|---|
| 2025 | $867 | $179,111 | $126,000 | $53,111 |
| 2024 | $867 | $183,107 | $126,000 | $57,107 |
| 2023 | $867 | $183,422 | $126,000 | $57,422 |
| 2022 | $1,606 | $155,404 | $108,000 | $47,404 |
| 2021 | $1,546 | $108,580 | $90,000 | $18,580 |
| 2020 | $1,460 | $107,532 | $90,000 | $17,532 |
| 2019 | $1,387 | $98,472 | $78,750 | $19,722 |
| 2018 | $712 | $75,494 | $56,250 | $19,244 |
| 2017 | $1,145 | $64,244 | $45,000 | $19,244 |
| 2016 | $1,041 | $49,244 | $30,000 | $19,244 |
| 2015 | -- | $49,244 | $30,000 | $19,244 |
| 2014 | -- | $0 | $0 | $0 |
Source: Public Records
Map
Nearby Homes
- 317 E 35th St Unit A
- 220 E 37th St
- 310 E 35th St
- 312 E 35th St
- 311 E 34th St Unit B
- 311 E 34th St Unit A
- 316 E 37th St
- 201 E 37th St
- 232 E 38th St
- 230 E 38th St
- 227 E 38th St
- 4006 Cortlandt St
- 4008 Cortlandt St
- 3417 Columbia St
- 140 E 37th St
- 234 E 39th St
- 308 E 39th St
- 3422 Columbia St
- 122 E 33rd St
- 3827 Arlington St
Your Personal Tour Guide
Ask me questions while you tour the home.