2161 Ohio St North Bend, OR 97459
Estimated Value: $244,320 - $252,000
2
Beds
1
Bath
860
Sq Ft
$289/Sq Ft
Est. Value
About This Home
This home is located at 2161 Ohio St, North Bend, OR 97459 and is currently estimated at $248,160, approximately $288 per square foot. 2161 Ohio St is a home located in Coos County with nearby schools including Hillcrest Elementary School, North Bend Middle School, and North Bend Senior High School.
Ownership History
Date
Name
Owned For
Owner Type
Purchase Details
Closed on
Jun 24, 2020
Sold by
Holling Robert F
Bought by
Kelly Obuba Emmanuel
Current Estimated Value
Home Financials for this Owner
Home Financials are based on the most recent Mortgage that was taken out on this home.
Original Mortgage
$68,732
Outstanding Balance
$60,791
Interest Rate
3.2%
Mortgage Type
FHA
Estimated Equity
$187,369
Purchase Details
Closed on
Feb 21, 2013
Sold by
Jenkins Colin D
Bought by
Holling Robert F
Home Financials for this Owner
Home Financials are based on the most recent Mortgage that was taken out on this home.
Original Mortgage
$66,720
Interest Rate
3.36%
Mortgage Type
Seller Take Back
Create a Home Valuation Report for This Property
The Home Valuation Report is an in-depth analysis detailing your home's value as well as a comparison with similar homes in the area
Purchase History
| Date | Buyer | Sale Price | Title Company |
|---|---|---|---|
| Kelly Obuba Emmanuel | $70,000 | Ticor Title Company Of Or | |
| Holling Robert F | $69,220 | Ticor Title Company |
Source: Public Records
Mortgage History
| Date | Status | Borrower | Loan Amount |
|---|---|---|---|
| Open | Kelly Obuba Emmanuel | $68,732 | |
| Previous Owner | Holling Robert F | $66,720 |
Source: Public Records
Tax History
| Year | Tax Paid | Tax Assessment Tax Assessment Total Assessment is a certain percentage of the fair market value that is determined by local assessors to be the total taxable value of land and additions on the property. | Land | Improvement |
|---|---|---|---|---|
| 2025 | $1,510 | $102,010 | -- | -- |
| 2024 | $1,524 | $99,040 | -- | -- |
| 2023 | $1,479 | $96,160 | $0 | $0 |
| 2022 | $1,463 | $93,360 | $0 | $0 |
| 2021 | $1,499 | $90,650 | $0 | $0 |
| 2020 | $1,404 | $90,650 | $0 | $0 |
| 2019 | $1,343 | $85,450 | $0 | $0 |
| 2018 | $1,306 | $82,970 | $0 | $0 |
| 2017 | $1,269 | $80,560 | $0 | $0 |
| 2016 | $1,231 | $78,220 | $0 | $0 |
| 2015 | $1,142 | $75,950 | $0 | $0 |
| 2014 | $1,142 | $73,870 | $0 | $0 |
Source: Public Records
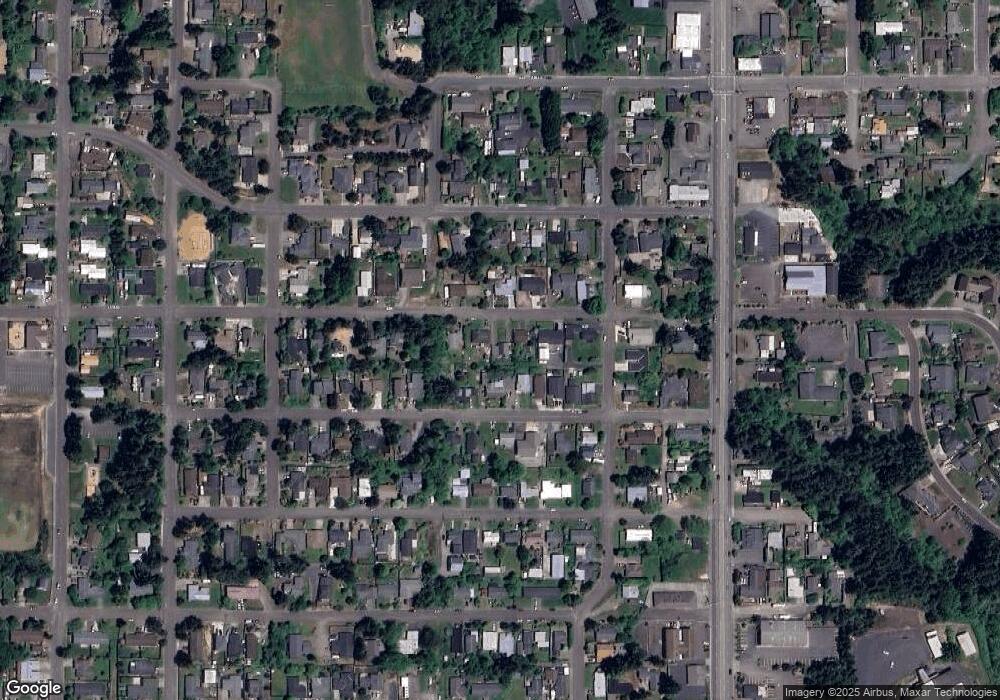
Map
Nearby Homes
Your Personal Tour Guide
Ask me questions while you tour the home.