
Seller's Agent in 2020
Lou Urrutia
Windermere Corporate
(425) 356-9107
40 Total Sales
Estimated Value: $1,378,838 - $1,646,000
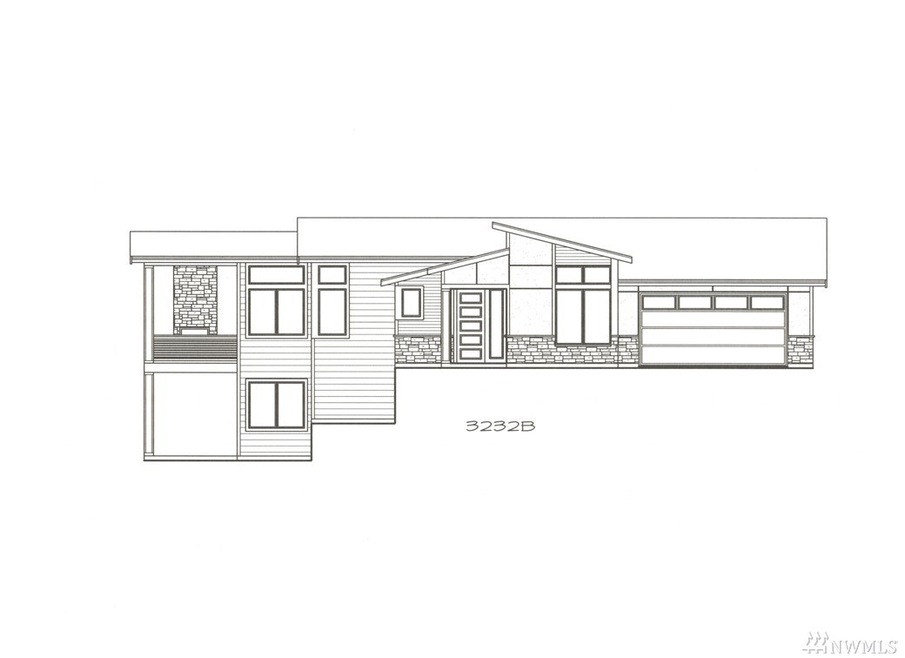
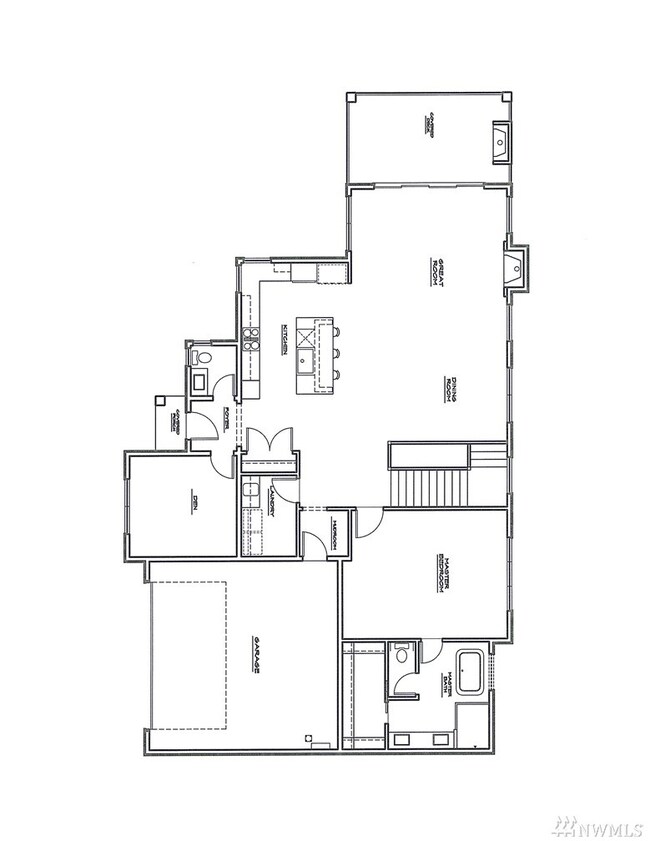
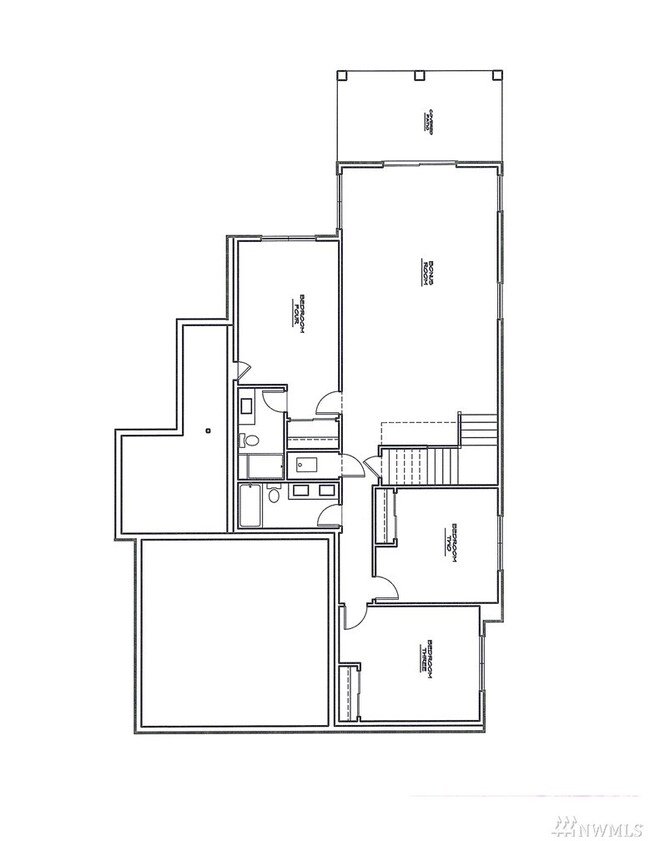
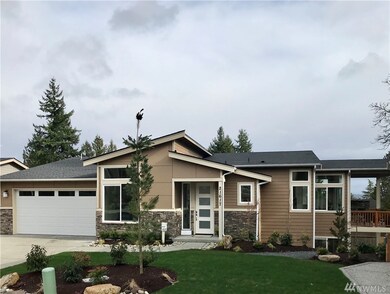
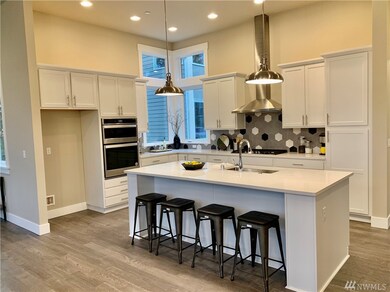
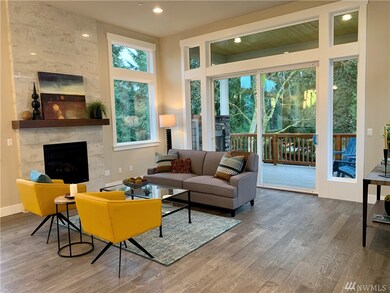
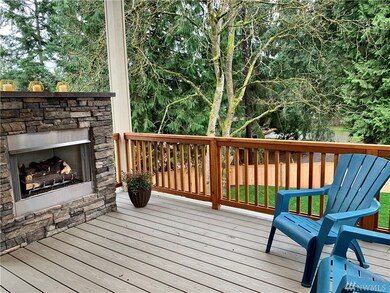
Welcome to Valley View Highlands in the Northshore School district! BRAND NEW 7 home development on a quiet cul-de-sac w/high-end finishes.This RAMBLER w/BASEMENT incl.'s a MAIN FLOOR MASTER w/walk-in closet & en-suite bath w/heated tile floors & sep soaking tub. liv spaces w/stone front fireplaces, kit w/quartz or granite ctrs (acc. to plan), tile backsplash & SS appliances. Great rm w/formal din area & fam rm w/fpl. Beautiful views of The Cascades thru nearly floor-to-ceiling windows.
Last Agent to Sell the Property
Windermere Real Estate/M2, LLC License #38331 Listed on: 11/17/2019
Source: Northwest Multiple Listing Service (NWMLS)
MLS#: NWM1542137
| Date | Buyer | Sale Price | Title Company |
|---|---|---|---|
| Oh Bok Joo | $109,388 | Chicago Title |
| Date | Status | Borrower | Loan Amount |
|---|---|---|---|
| Open | Oh Bok Joo | $550,000 |
| Date | Event | Price | List to Sale | Price per Sq Ft |
|---|---|---|---|---|
| 05/01/2020 05/01/20 | Sold | $1,059,000 | 0.0% | $328 / Sq Ft |
| 03/02/2020 03/02/20 | Pending | -- | -- | -- |
| 11/17/2019 11/17/19 | For Sale | $1,059,000 | -- | $328 / Sq Ft |
| Year | Tax Paid | Tax Assessment Tax Assessment Total Assessment is a certain percentage of the fair market value that is determined by local assessors to be the total taxable value of land and additions on the property. | Land | Improvement |
|---|---|---|---|---|
| 2026 | $9,724 | $1,366,100 | $747,700 | $618,400 |
| 2025 | $9,667 | $1,162,600 | $561,000 | $601,600 |
| 2024 | $9,667 | $1,153,500 | $566,100 | $587,400 |
| 2023 | $9,724 | $1,266,700 | $650,000 | $616,700 |
| 2022 | $9,122 | $959,700 | $440,000 | $519,700 |
| 2020 | $5,129 | $815,300 | $351,000 | $464,300 |
| 2019 | $2,514 | $322,000 | $322,000 | $0 |
| 2018 | $0 | $0 | $0 | $0 |
Seller's Agent in 2020
Lou Urrutia
Windermere Corporate
(425) 356-9107
40 Total Sales
Buyer's Agent in 2020
Christina Chong
COMPASS
(206) 551-5909
33 Total Sales
Source: Northwest Multiple Listing Service (NWMLS)
MLS Number: NWM1542137
APN: 005322-000-021-03
Disclaimer: Certain information contained herein is derived from information provided by parties other than Homes.com. All information provided is deemed reliable, but is not guaranteed to be accurate and should be independently verified.
![]() All data is obtained from various sources and may not have been verified by broker or MLS GRID. Supplied Open House Information is subject to change without notice. All information should be independently reviewed and verified for accuracy. Properties may or may not be listed by the office/agent presenting the information. Listing information is provided by the Northwest Multiple Listing Service (NWMLS). Property information is based on available data that may include MLS information, county records, and other sources. Listings marked with the 3 tree icon and provided by NWMLS. All properties are subject to prior sale or withdrawal. IDX information is provided exclusively for consumers’ personal noncommercial use, that it may not be used for any purpose other than to identify prospective properties consumers may be interested in purchasing, that the data is deemed reliable but is not guaranteed by MLS GRID. ©2026 NWMLS.
All data is obtained from various sources and may not have been verified by broker or MLS GRID. Supplied Open House Information is subject to change without notice. All information should be independently reviewed and verified for accuracy. Properties may or may not be listed by the office/agent presenting the information. Listing information is provided by the Northwest Multiple Listing Service (NWMLS). Property information is based on available data that may include MLS information, county records, and other sources. Listings marked with the 3 tree icon and provided by NWMLS. All properties are subject to prior sale or withdrawal. IDX information is provided exclusively for consumers’ personal noncommercial use, that it may not be used for any purpose other than to identify prospective properties consumers may be interested in purchasing, that the data is deemed reliable but is not guaranteed by MLS GRID. ©2026 NWMLS.
Based on information submitted to the MLS GRID
Ask me questions while you tour the home.