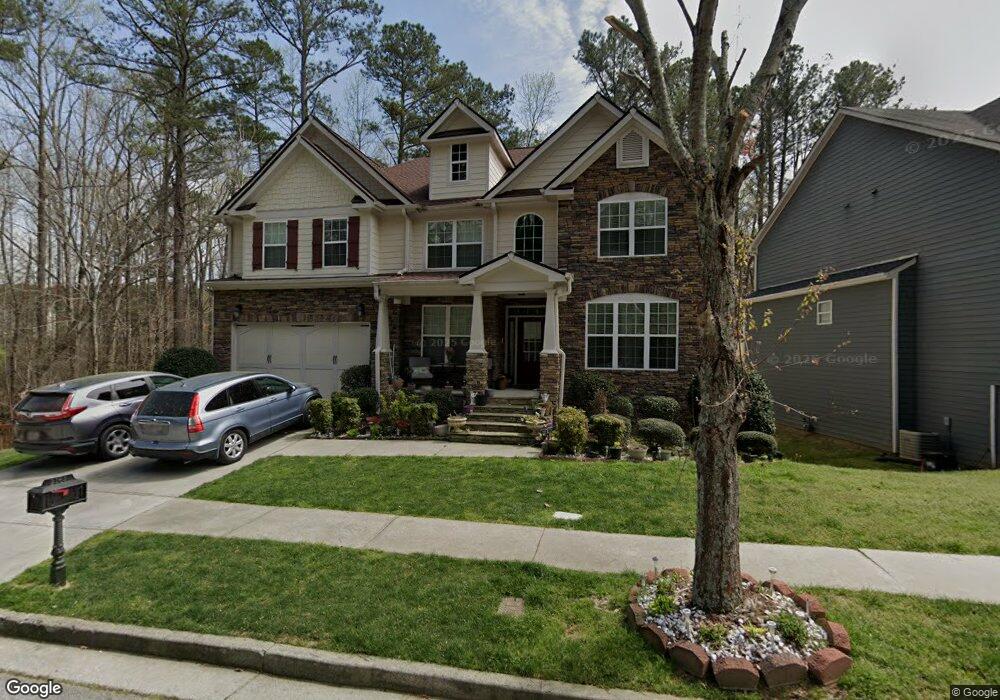
2163 Leafmore Ct Grayson, GA 30017
Loganville AreaEstimated Value: $505,000 - $545,000
5
Beds
4
Baths
3,529
Sq Ft
$147/Sq Ft
Est. Value
About This Home
This home is located at 2163 Leafmore Ct, Grayson, GA 30017 and is currently estimated at $520,429, approximately $147 per square foot. 2163 Leafmore Ct is a home located in Gwinnett County with nearby schools including W.J. Cooper Elementary School, McConnell Middle School, and Archer High School.
Create a Home Valuation Report for This Property
The Home Valuation Report is an in-depth analysis detailing your home's value as well as a comparison with similar homes in the area
Home Values in the Area
Average Home Value in this Area
Tax History
We collect this data history from publicly available records. To have your information removed, we recommend requesting removal directly through your county’s website.
| Year | Tax Paid | Tax Assessment Tax Assessment Total Assessment is a certain percentage of the fair market value that is determined by local assessors to be the total taxable value of land and additions on the property. | Land | Improvement |
|---|---|---|---|---|
| 2025 | $1,612 | $232,000 | $30,000 | $202,000 |
| 2024 | $1,613 | $217,040 | $30,000 | $187,040 |
| 2023 | $1,613 | $201,000 | $34,000 | $167,000 |
| 2022 | $1,562 | $187,120 | $31,600 | $155,520 |
| 2021 | $1,538 | $136,680 | $23,200 | $113,480 |
| 2020 | $1,535 | $128,880 | $20,800 | $108,080 |
| 2019 | $1,409 | $128,880 | $20,800 | $108,080 |
| 2018 | $1,391 | $115,280 | $20,800 | $94,480 |
| 2016 | $3,524 | $97,600 | $16,400 | $81,200 |
| 2015 | $3,537 | $96,480 | $12,000 | $84,480 |
| 2014 | -- | $96,480 | $12,000 | $84,480 |
Source: Public Records
Map
Nearby Homes
- 2143 Leafmore Ct
- 1458 High Falls Ln
- 341 Chandler Bluff Ct SE
- 213 Soseby Lake Ln
- 460 Chandler Bluff Ct
- 1648 High Falls Ln
- 561 Tallulah Ln
- 1339 High Falls Ln
- 2266 Orion Ct Unit 3
- 1329 High Falls Ln
- 566 Tallulah Ln
- 571 Tallulah Ln
- 2128 Cluster Ln
- 1881 Flowering Dr Unit 3
- 615 Clark Lake Estates Dr
- 445 Flowering Trail
- 1638 High Falls Ln
- 2545 Amberbrook Ln Unit 1
- 185 Amberbrook Cir
- 2380 Camp Mitchell Rd
- 2133 Leafmore Ct SE
- 2133 Leafmore Ct Unit 26
- 2133 Leafmore Ct
- 2143 Leafmore Ct Unit 27
- 2103 Leafmore Ct Unit 25
- 2103 Leafmore Ct
- 2103 Leafmore Ct SE
- 2093 Leafmore Ct
- 2153 Leafmore Ct
- 2136 Leafmore Ct
- 2126 Leafmore Ct
- 2083 Leafmore Ct SE
- 2116 Leafmore Ct
- 2116 Leafmore Ct SE
- 2083 Leafmore Ct
- 2106 Leafmore Ct
- 2096 Leafmore Ct
- 2073 Leafmore Ct
- 2086 Leafmore Ct SE
- 2086 Leafmore Ct
Your Personal Tour Guide
Ask me questions while you tour the home.