2165 Pine St North Bend, OR 97459
Estimated Value: $563,534 - $710,000
4
Beds
2
Baths
2,232
Sq Ft
$285/Sq Ft
Est. Value
About This Home
This home is located at 2165 Pine St, North Bend, OR 97459 and is currently estimated at $636,767, approximately $285 per square foot. 2165 Pine St is a home located in Coos County with nearby schools including Hillcrest Elementary School, North Bend Middle School, and North Bend Senior High School.
Ownership History
Date
Name
Owned For
Owner Type
Purchase Details
Closed on
Mar 31, 2022
Sold by
Kirk Johnson
Bought by
Johnson Zachary and Johnson Holly
Current Estimated Value
Home Financials for this Owner
Home Financials are based on the most recent Mortgage that was taken out on this home.
Original Mortgage
$300,000
Outstanding Balance
$282,110
Interest Rate
4.67%
Mortgage Type
New Conventional
Estimated Equity
$354,657
Purchase Details
Closed on
Jun 17, 2016
Sold by
S & J Estates Llc
Bought by
Johnson Kirk and Johnson Gayline
Create a Home Valuation Report for This Property
The Home Valuation Report is an in-depth analysis detailing your home's value as well as a comparison with similar homes in the area
Purchase History
| Date | Buyer | Sale Price | Title Company |
|---|---|---|---|
| Johnson Zachary | $500,000 | Ticor Title | |
| Johnson Kirk | -- | None Available |
Source: Public Records
Mortgage History
| Date | Status | Borrower | Loan Amount |
|---|---|---|---|
| Open | Johnson Zachary | $300,000 |
Source: Public Records
Tax History
| Year | Tax Paid | Tax Assessment Tax Assessment Total Assessment is a certain percentage of the fair market value that is determined by local assessors to be the total taxable value of land and additions on the property. | Land | Improvement |
|---|---|---|---|---|
| 2025 | $4,567 | $308,600 | -- | -- |
| 2024 | $4,610 | $299,620 | -- | -- |
| 2023 | $4,475 | $290,900 | $0 | $0 |
| 2022 | $4,427 | $282,430 | $0 | $0 |
| 2021 | $4,535 | $274,210 | $0 | $0 |
| 2020 | $4,248 | $274,210 | $0 | $0 |
| 2019 | $4,063 | $258,480 | $0 | $0 |
| 2018 | $3,949 | $250,960 | $0 | $0 |
| 2017 | $1,231 | $78,120 | $0 | $0 |
| 2016 | $1,194 | $75,850 | $0 | $0 |
| 2015 | $1,176 | $66,120 | $0 | $0 |
| 2014 | $1,176 | $64,820 | $0 | $0 |
Source: Public Records
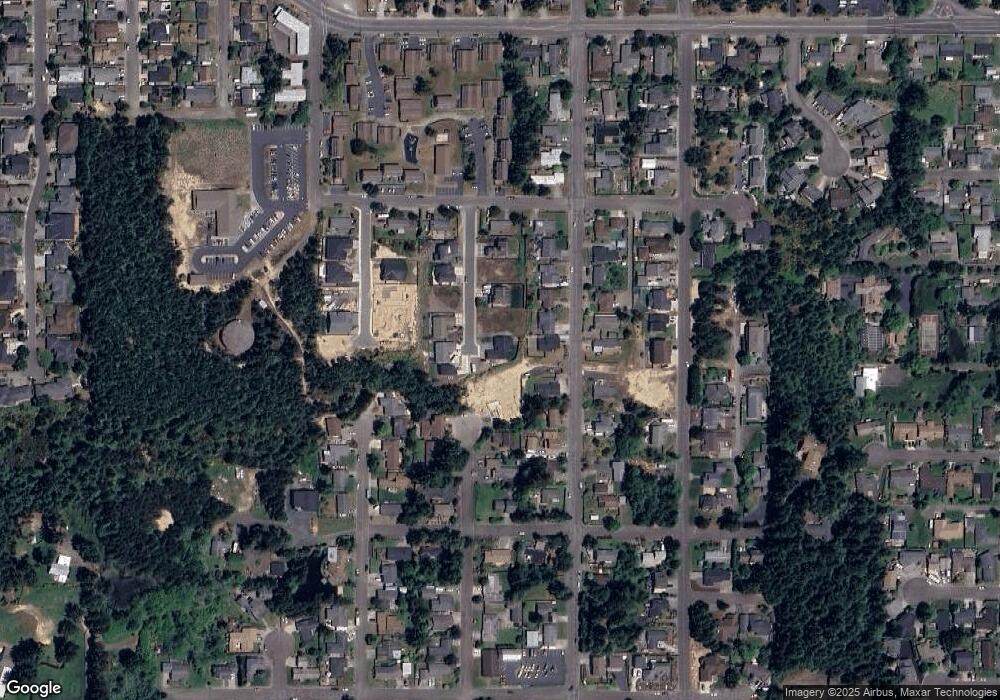
Map
Nearby Homes
Your Personal Tour Guide
Ask me questions while you tour the home.