Estimated Value: $71,268 - $155,000
2
Beds
1
Bath
768
Sq Ft
$159/Sq Ft
Est. Value
About This Home
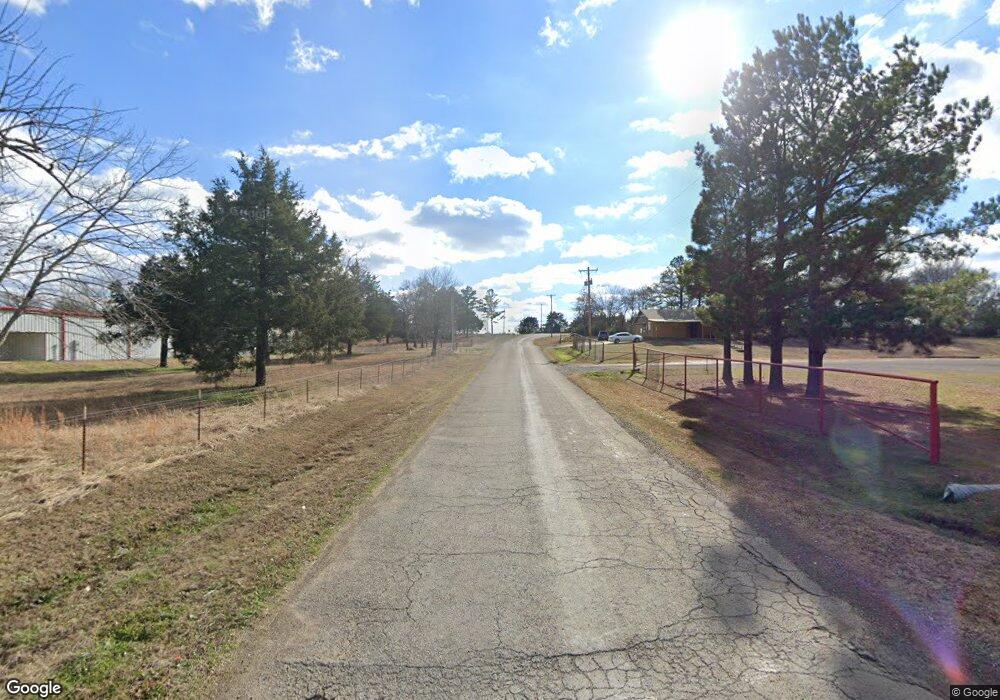
This home is located at 21699 W Main St, Howe, OK 74940 and is currently estimated at $122,067, approximately $158 per square foot. 21699 W Main St is a home with nearby schools including Howe Elementary School and Howe High School.
Ownership History
Date
Name
Owned For
Owner Type
Purchase Details
Closed on
Sep 3, 2019
Sold by
Cox Bobby
Bought by
Zcb Investments Llc
Current Estimated Value
Create a Home Valuation Report for This Property
The Home Valuation Report is an in-depth analysis detailing your home's value as well as a comparison with similar homes in the area
Purchase History
We collect this data history from publicly available records. To have your information removed, we recommend requesting removal directly through your county’s website.
| Date | Buyer | Sale Price | Title Company |
|---|---|---|---|
| Zcb Investments Llc | -- | None Available |
Source: Public Records
Tax History
| Year | Tax Paid | Tax Assessment Tax Assessment Total Assessment is a certain percentage of the fair market value that is determined by local assessors to be the total taxable value of land and additions on the property. | Land | Improvement |
|---|---|---|---|---|
| 2025 | $284 | $3,285 | $206 | $3,079 |
| 2023 | $271 | $2,980 | $206 | $2,774 |
| 2022 | $248 | $2,838 | $206 | $2,632 |
| 2021 | $235 | $2,703 | $206 | $2,497 |
| 2020 | $242 | $2,763 | $206 | $2,557 |
| 2019 | $254 | $2,895 | $206 | $2,689 |
| 2018 | $249 | $2,824 | $206 | $2,618 |
| 2017 | $249 | $2,820 | $206 | $2,614 |
| 2016 | $274 | $3,077 | $206 | $2,871 |
| 2015 | $278 | $3,122 | $206 | $2,916 |
| 2014 | $383 | $4,235 | $206 | $4,029 |
Source: Public Records
Map
Nearby Homes
- 39803 Cedar Hills Cir
- 39777 Choctaw Ave
- 39689 Texas Ave
- 21894 Cedar Hills Dr
- 21406 6th St
- 21415 6th St
- 130 Nobles Rd
- 39929 W Drury Ln
- 21887 Ranch Rd
- 40501 210th Ave
- TBD Scenic View Dr
- TBD Smokey Ln
- TBD Alicia Ln
- TBD* Alicia Ln
- TBD** Alicia Ln
- 23090 J O B Rd
- TBD Us Highway 270
- 22853 Us Highway 270
- TBD Old Pike Rd
- 39827 Morris Creek Rd
- 21707 W Main St
- 21635 W Main St
- 21663 W 1st St
- 21347 Main St
- 21709 W 1st St
- 21621 W 1st St
- 21797 W Main St
- 39436 Kiowa Ave
- 21802 W Main St
- 21695 Ivy St
- 39466 Choctaw Ave
- 21692 Ivy St
- 39522 Choctaw Ave
- 39601 Choctaw Ave
- 21845 W North Railroad
- 21485 W 1st St
- TBD Ivy St
- 349422 Ivy St
- 39314 Pine St
- 39588 Choctaw Ave
Your Personal Tour Guide
Ask me questions while you tour the home.