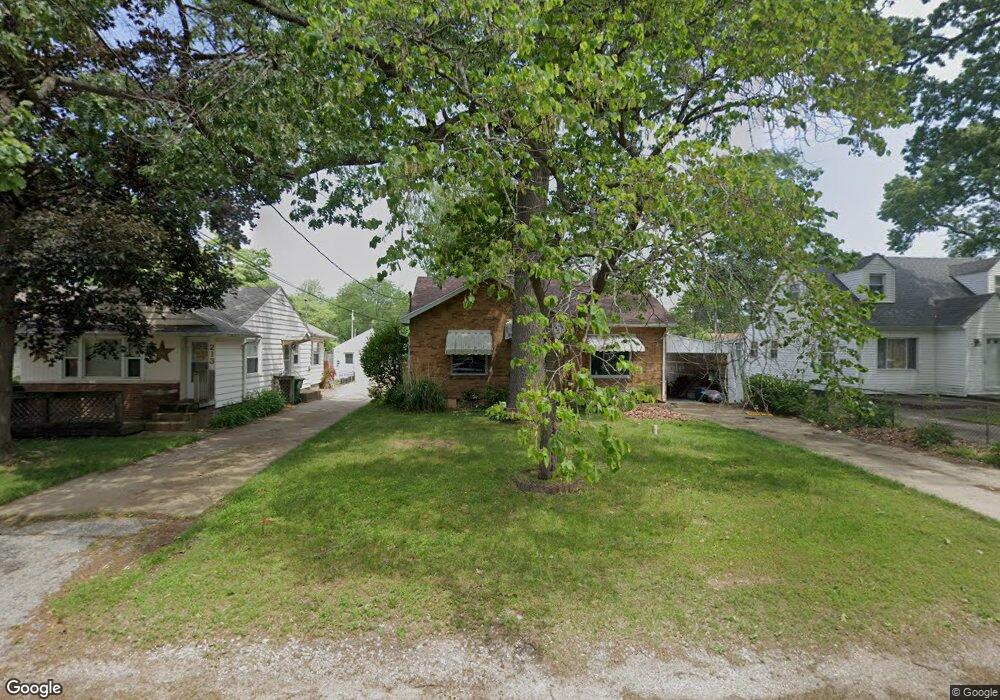
217 David St South Bend, IN 46637
South Bend AreaEstimated Value: $151,000 - $173,000
About This Home
This home is located at 217 David St, South Bend, IN 46637 and is currently estimated at $163,744, approximately $160 per square foot. 217 David St is a home located in St. Joseph County with nearby schools including Clay Intermediate Center, Muessel Primary Center, and Edison Middle School.
Ownership History
We collect this data history from publicly available records. To have your information removed, we recommend requesting removal directly through your county’s website.
Purchase Details
Home Financials for this Owner
Home Financials are based on the most recent Mortgage that was taken out on this home.Purchase History
We collect this data history from publicly available records. To have your information removed, we recommend requesting removal directly through your county’s website.
| Date | Buyer | Sale Price | Title Company |
|---|---|---|---|
| -- | -- |
Mortgage History
We collect this data history from publicly available records. To have your information removed, we recommend requesting removal directly through your county’s website.
| Date | Status | Borrower | Loan Amount |
|---|---|---|---|
| Closed | $49,400 | ||
| Closed | $59,800 |
Tax History
We collect this data history from publicly available records. To have your information removed, we recommend requesting removal directly through your county’s website.
| Year | Tax Paid | Tax Assessment Tax Assessment Total Assessment is a certain percentage of the fair market value that is determined by local assessors to be the total taxable value of land and additions on the property. | Land | Improvement |
|---|---|---|---|---|
| 2025 | $955 | $112,800 | $16,800 | $96,000 |
| 2024 | $341 | $106,100 | $16,800 | $89,300 |
| 2023 | $521 | $50,100 | $16,800 | $33,300 |
| 2022 | $521 | $79,000 | $22,900 | $56,100 |
| 2021 | $369 | $55,100 | $10,100 | $45,000 |
| 2020 | $394 | $58,300 | $10,700 | $47,600 |
| 2019 | $370 | $61,900 | $11,400 | $50,500 |
| 2018 | $374 | $87,900 | $11,400 | $76,500 |
| 2017 | $733 | $90,200 | $11,400 | $78,800 |
| 2016 | $288 | $48,400 | $7,800 | $40,600 |
| 2014 | $284 | $47,800 | $7,800 | $40,000 |
Map
- 53463 Old Woodbridge Ct Unit 6
- 53434 Old Woodbridge Ct Unit 2
- 53468 Old Woodbridge Ct Unit 5
- 125 Myrtle St Unit 20
- 53475 Hansel Ln
- 19330 Foley Cir S
- 53150 Ridgewood Dr
- 53146 Oakmont Central Dr
- 127 Clancey St
- 19556 Paxson Dr N
- 126 E Cripe St
- 411 Abbey St
- 52853 N Francis St
- 52770 Brooktrails Dr
- 19674 Dubois Ave
- 18655 Cleveland Rd
- 18597 Bracken Fern Ct
- 52823 W Cypress Cir
- 20221 Darden Rd
- 52882 Camellia Dr
Ask me questions while you tour the home.