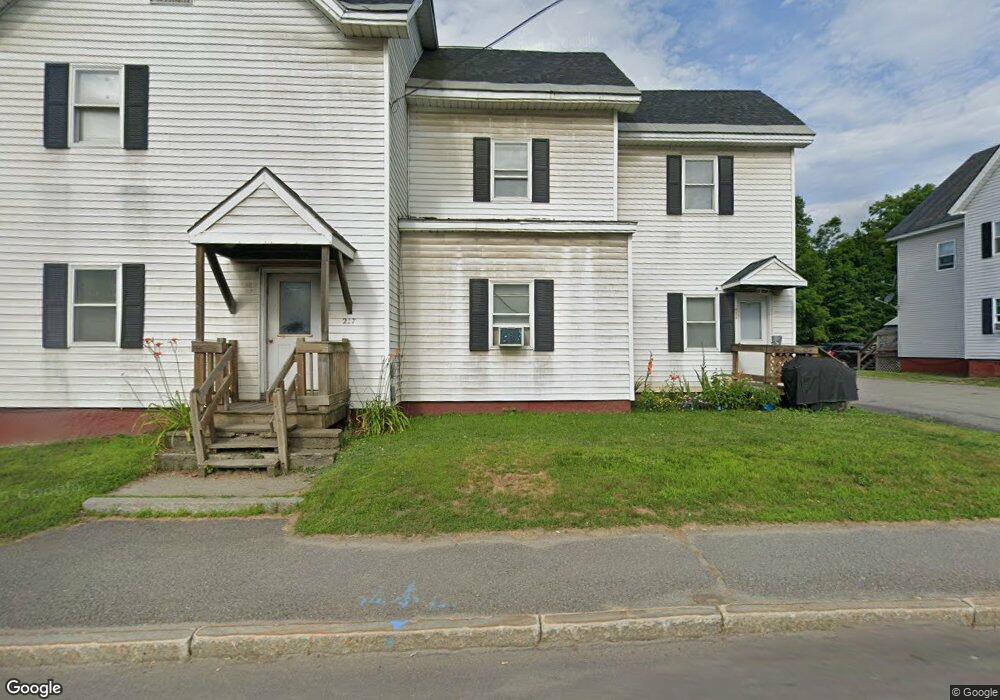
217 Main St Fairfield, ME 04937
Estimated Value: $231,000 - $252,000
--
Bed
4
Baths
2,294
Sq Ft
$105/Sq Ft
Est. Value
About This Home
This home is located at 217 Main St, Fairfield, ME 04937 and is currently estimated at $240,536, approximately $104 per square foot. 217 Main St is a home with nearby schools including Lawrence High School, Kennebec Montessori School, and St John Catholic School.
Ownership History
Date
Name
Owned For
Owner Type
Purchase Details
Closed on
Aug 3, 2022
Sold by
Gordon Jeremy L
Bought by
77 Main Street Llc
Current Estimated Value
Home Financials for this Owner
Home Financials are based on the most recent Mortgage that was taken out on this home.
Original Mortgage
$141,080
Outstanding Balance
$134,651
Interest Rate
5.3%
Mortgage Type
Purchase Money Mortgage
Estimated Equity
$105,885
Purchase Details
Closed on
Aug 21, 2015
Sold by
Doyon Robert R and Doyon Sandra J
Bought by
Gordon Jeremy L
Home Financials for this Owner
Home Financials are based on the most recent Mortgage that was taken out on this home.
Original Mortgage
$208,000
Interest Rate
4.07%
Mortgage Type
New Conventional
Create a Home Valuation Report for This Property
The Home Valuation Report is an in-depth analysis detailing your home's value as well as a comparison with similar homes in the area
Home Values in the Area
Average Home Value in this Area
Purchase History
| Date | Buyer | Sale Price | Title Company |
|---|---|---|---|
| 77 Main Street Llc | -- | None Available | |
| Gordon Jeremy L | -- | -- |
Source: Public Records
Mortgage History
| Date | Status | Borrower | Loan Amount |
|---|---|---|---|
| Open | 77 Main Street Llc | $141,080 | |
| Previous Owner | Gordon Jeremy L | $208,000 |
Source: Public Records
Tax History
| Year | Tax Paid | Tax Assessment Tax Assessment Total Assessment is a certain percentage of the fair market value that is determined by local assessors to be the total taxable value of land and additions on the property. | Land | Improvement |
|---|---|---|---|---|
| 2023 | $1,527 | $71,000 | $19,700 | $51,300 |
| 2022 | $1,491 | $71,000 | $19,700 | $51,300 |
| 2021 | $1,562 | $71,000 | $19,700 | $51,300 |
| 2020 | $1,583 | $71,000 | $19,700 | $51,300 |
| 2019 | $1,583 | $71,000 | $19,700 | $51,300 |
| 2018 | $1,619 | $71,000 | $19,700 | $51,300 |
| 2017 | $1,619 | $71,000 | $19,700 | $51,300 |
| 2016 | $1,590 | $71,000 | $19,700 | $51,300 |
| 2015 | $1,541 | $71,000 | $19,700 | $51,300 |
| 2014 | $1,438 | $71,000 | $19,700 | $51,300 |
| 2013 | $1,438 | $71,000 | $19,700 | $51,300 |
Source: Public Records
Map
Nearby Homes
Your Personal Tour Guide
Ask me questions while you tour the home.