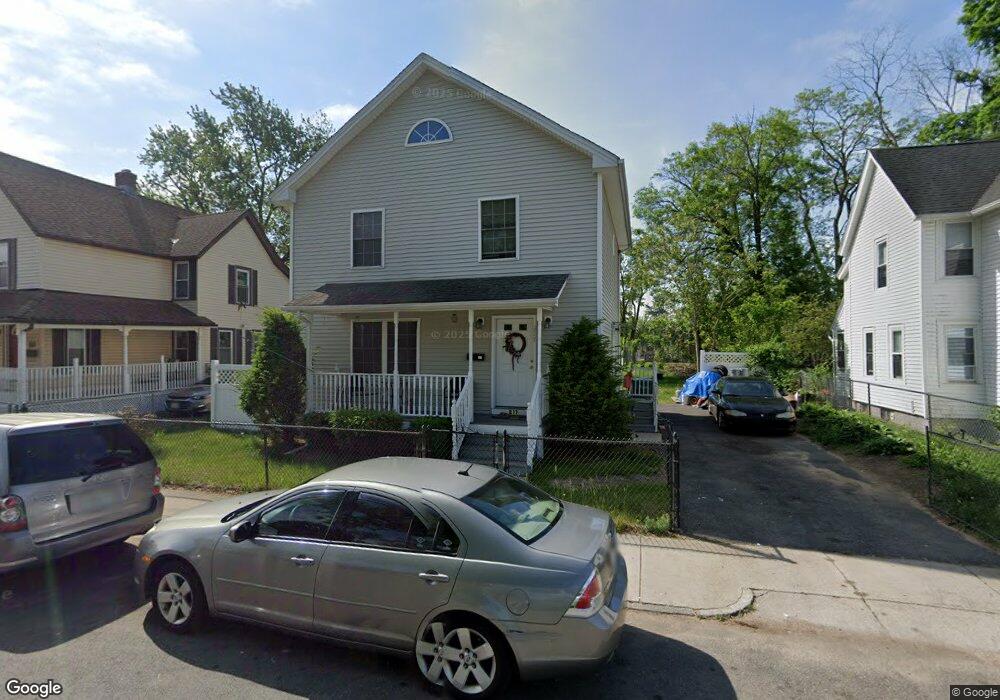
217 Tyler St Springfield, MA 01109
Old Hill NeighborhoodEstimated Value: $190,000 - $247,000
3
Beds
2
Baths
1,378
Sq Ft
$160/Sq Ft
Est. Value
About This Home
This home is located at 217 Tyler St, Springfield, MA 01109 and is currently estimated at $220,053, approximately $159 per square foot. 217 Tyler St is a home located in Hampden County with nearby schools including William N. DeBerry Elementary School, M Marcus Kiley Middle, and High School Of Commerce.
Ownership History
Date
Name
Owned For
Owner Type
Purchase Details
Closed on
Sep 28, 2010
Sold by
Spri Nbrhd Hsng
Bought by
Kilpatrick Gladys
Current Estimated Value
Home Financials for this Owner
Home Financials are based on the most recent Mortgage that was taken out on this home.
Original Mortgage
$84,668
Outstanding Balance
$54,697
Interest Rate
4.48%
Mortgage Type
Purchase Money Mortgage
Estimated Equity
$165,356
Purchase Details
Closed on
Dec 31, 1999
Sold by
Jacobson Glenn and Jacobson Lee
Bought by
Cj&J Rlty Inc
Create a Home Valuation Report for This Property
The Home Valuation Report is an in-depth analysis detailing your home's value as well as a comparison with similar homes in the area
Home Values in the Area
Average Home Value in this Area
Purchase History
| Date | Buyer | Sale Price | Title Company |
|---|---|---|---|
| Kilpatrick Gladys | $80,000 | -- | |
| Cj&J Rlty Inc | $6,000 | -- |
Source: Public Records
Mortgage History
| Date | Status | Borrower | Loan Amount |
|---|---|---|---|
| Open | Kilpatrick Gladys | $84,668 | |
| Closed | Cj&J Rlty Inc | $21,400 |
Source: Public Records
Tax History
| Year | Tax Paid | Tax Assessment Tax Assessment Total Assessment is a certain percentage of the fair market value that is determined by local assessors to be the total taxable value of land and additions on the property. | Land | Improvement |
|---|---|---|---|---|
| 2025 | $1,254 | $80,000 | $18,500 | $61,500 |
| 2024 | $1,285 | $80,000 | $18,500 | $61,500 |
| 2023 | $1,364 | $80,000 | $18,500 | $61,500 |
| 2022 | $1,506 | $80,000 | $18,500 | $61,500 |
| 2021 | $1,512 | $80,000 | $18,500 | $61,500 |
| 2020 | $1,562 | $80,000 | $18,500 | $61,500 |
| 2019 | $1,574 | $80,000 | $18,500 | $61,500 |
| 2018 | $1,574 | $80,000 | $18,500 | $61,500 |
| 2017 | $3,004 | $152,800 | $15,500 | $137,300 |
| 2016 | $2,910 | $148,000 | $15,500 | $132,500 |
| 2015 | $2,888 | $146,800 | $15,500 | $131,300 |
Source: Public Records
Map
Nearby Homes
- 109 Pendleton Ave
- 157 Lebanon St
- 118 Quincy St
- 583 Union St
- 108-110 Northampton Ave
- 11 Carpenter Ct
- 115-117 Northampton Ave
- 540-542 Union St
- 536-538 Union St
- 21 Westford Cir
- 52 Thompson St
- 113-117 Cedar St
- 49 Andrew St
- 20 Conklin St
- 65 Montrose St
- 158 Bowles St
- 186 Buckingham St
- 0 Allen St (Ss)
- 0 Central St
- 229 Central St
Your Personal Tour Guide
Ask me questions while you tour the home.