Estimated Value: $141,000 - $160,731
3
Beds
1
Bath
1,275
Sq Ft
$118/Sq Ft
Est. Value
About This Home
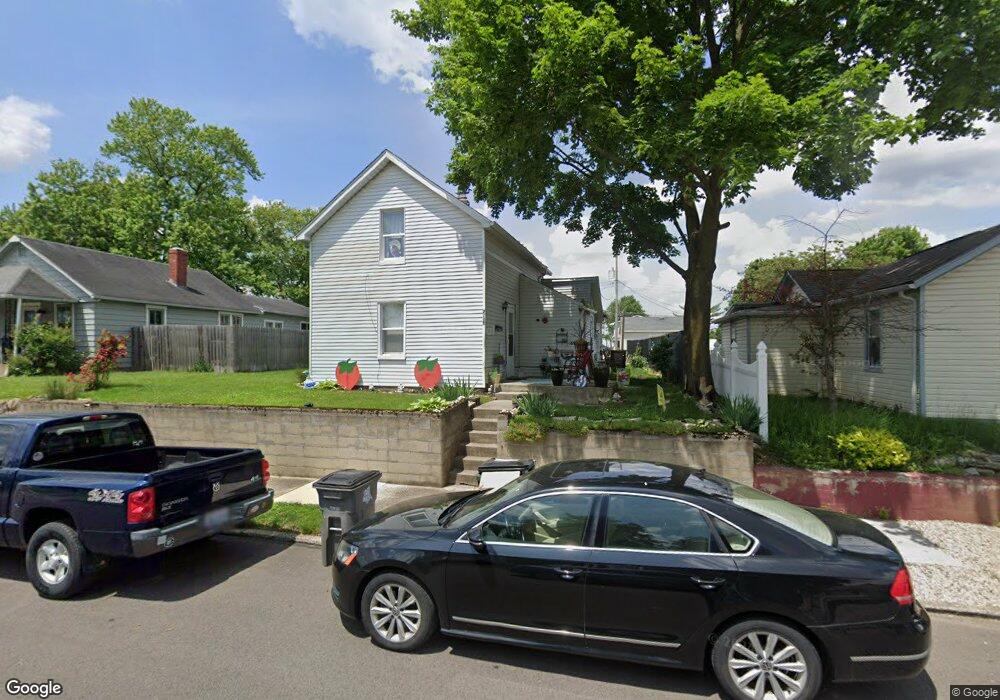
This home is located at 218 Morehead St, Troy, OH 45373 and is currently estimated at $150,933, approximately $118 per square foot. 218 Morehead St is a home located in Miami County with nearby schools including Forest Elementary School, Van Cleve Elementary School, and Troy Junior High School.
Ownership History
Date
Name
Owned For
Owner Type
Purchase Details
Closed on
Apr 5, 2021
Sold by
Dysinger Thomas E and Davis Charles R
Bought by
Viglione Peggy
Current Estimated Value
Home Financials for this Owner
Home Financials are based on the most recent Mortgage that was taken out on this home.
Original Mortgage
$86,406
Outstanding Balance
$76,713
Interest Rate
2.8%
Mortgage Type
FHA
Estimated Equity
$74,220
Purchase Details
Closed on
Jan 1, 1985
Bought by
Davis Charles R
Create a Home Valuation Report for This Property
The Home Valuation Report is an in-depth analysis detailing your home's value as well as a comparison with similar homes in the area
Home Values in the Area
Average Home Value in this Area
Purchase History
We collect this data history from publicly available records. To have your information removed, we recommend requesting removal directly through your county’s website.
| Date | Buyer | Sale Price | Title Company |
|---|---|---|---|
| Viglione Peggy | $88,000 | Old Republic Title | |
| Dysinger Thomas E | $88,000 | None Listed On Document | |
| Davis Charles R | $17,100 | -- |
Source: Public Records
Mortgage History
We collect this data history from publicly available records. To have your information removed, we recommend requesting removal directly through your county’s website.
| Date | Status | Borrower | Loan Amount |
|---|---|---|---|
| Open | Viglione Peggy | $86,406 |
Source: Public Records
Tax History
| Year | Tax Paid | Tax Assessment Tax Assessment Total Assessment is a certain percentage of the fair market value that is determined by local assessors to be the total taxable value of land and additions on the property. | Land | Improvement |
|---|---|---|---|---|
| 2025 | $1,674 | $44,170 | $7,980 | $36,190 |
| 2024 | $1,674 | $33,320 | $8,330 | $24,990 |
| 2023 | $1,410 | $33,320 | $8,330 | $24,990 |
| 2022 | $1,200 | $33,320 | $8,330 | $24,990 |
| 2021 | $905 | $26,640 | $6,650 | $19,990 |
| 2020 | $907 | $26,640 | $6,650 | $19,990 |
| 2019 | $915 | $26,640 | $6,650 | $19,990 |
| 2018 | $883 | $24,720 | $7,180 | $17,540 |
| 2017 | $892 | $24,720 | $7,180 | $17,540 |
| 2016 | $880 | $24,720 | $7,180 | $17,540 |
| 2015 | $850 | $22,890 | $6,650 | $16,240 |
| 2014 | $850 | $22,890 | $6,650 | $16,240 |
| 2013 | $856 | $22,890 | $6,650 | $16,240 |
Source: Public Records
Map
Nearby Homes
- 1014 Race Dr
- 504 S Counts St
- 633 Floral Ave
- 619 E Canal St
- 601 E Canal St
- 2183 Emerson Way
- 436 S Clay St
- 1003 S Mulberry St
- 431 S Walnut St
- 220 Racer St
- 0 St Rt 718 Unit Lot 2
- 514 S Walnut St
- 534 S Walnut St
- 118 S Walnut St
- 831 S Market St
- 504 S Market St
- 517 S Cherry St
- 28 W Canal St
- 67 W Dakota St
- 14 W Canal St
Your Personal Tour Guide
Ask me questions while you tour the home.