2191 Antioch Rd Lagrange, GA 30240
LaGrange AreaEstimated Value: $40,000 - $171,000
About This Home
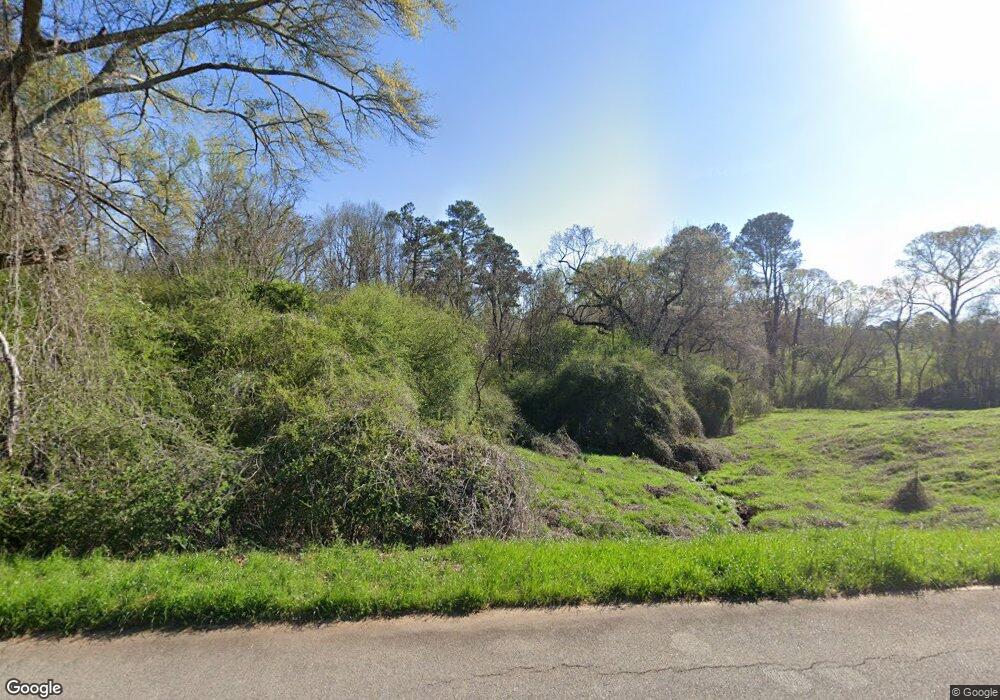
This home is located at 2191 Antioch Rd, Lagrange, GA 30240 and is currently estimated at $87,516, approximately $86 per square foot. 2191 Antioch Rd is a home located in Troup County with nearby schools including Hillcrest Elementary School, Franklin Forest Elementary School, and Hollis Hand Elementary School.
Ownership History
We collect this data history from publicly available records. To have your information removed, we recommend requesting removal directly through your county’s website.
Purchase Details
Purchase Details
Purchase Details
Purchase Details
Purchase Details
Purchase Details
Purchase Details
Purchase Details
Purchase Details
Purchase Details
Purchase Details
Purchase Details
Purchase History
We collect this data history from publicly available records. To have your information removed, we recommend requesting removal directly through your county’s website.
| Date | Buyer | Sale Price | Title Company |
|---|---|---|---|
| $6,500 | -- | ||
| -- | -- | ||
| $25,000 | -- | ||
| $10,000 | -- | ||
| -- | -- | ||
| $16,000 | -- | ||
| -- | -- | ||
| -- | -- | ||
| -- | -- | ||
| $8,600 | -- | ||
| -- | -- | ||
| -- | -- |
Tax History
We collect this data history from publicly available records. To have your information removed, we recommend requesting removal directly through your county’s website.
| Year | Tax Paid | Tax Assessment Tax Assessment Total Assessment is a certain percentage of the fair market value that is determined by local assessors to be the total taxable value of land and additions on the property. | Land | Improvement |
|---|---|---|---|---|
| 2025 | $337 | $12,340 | $12,000 | $340 |
| 2024 | $337 | $12,340 | $12,000 | $340 |
| 2023 | $337 | $12,340 | $12,000 | $340 |
| 2022 | $344 | $12,340 | $12,000 | $340 |
| 2021 | $146 | $4,844 | $4,240 | $604 |
| 2020 | $147 | $4,880 | $4,060 | $820 |
| 2019 | $148 | $4,900 | $4,060 | $840 |
| 2018 | $145 | $4,824 | $4,060 | $764 |
| 2017 | $145 | $4,824 | $4,060 | $764 |
| 2016 | $145 | $4,802 | $4,060 | $742 |
| 2015 | $145 | $4,802 | $4,060 | $742 |
| 2014 | $154 | $5,094 | $4,060 | $1,034 |
| 2013 | -- | $5,121 | $4,060 | $1,061 |
Map
- 0 Liberty Hill Rd Unit 231760
- 265 Neely Rd
- 1206 the Reserve
- 379 Retreat Trail
- 227 Retreat Trail
- 291 Retreat Trail
- 5 Firefly Run
- 325 Retreat Trail
- 33 Wolf Creek Cove
- 178 Wolf Creek Cove
- 56 Firefly Run
- 40 Wolf Creek Cove
- 85 Wolf Creek Cove
- 100 Wolf Creek Cove
- 144 Wolf Creek Cove
- 143 Cameron Pointe Dr
- 93 Wolf Creek Cove
- 84 Firefly Run
- 105 Wolf Creek Cove
- 36 Fish Camp
- 0 Liberty Hill Rd Unit 10408995
- 0 Liberty Hill Rd Unit 10364130
- 0 Liberty Hill Rd Unit 10275211
- 0 Liberty Hill Rd Unit 20094088
- 0 Liberty Hill-Glenn Rd Unit 7318112
- 0 Liberty Hill Rd Unit 121.42+/- ac 8667406
- 0 Liberty Hill Rd Unit 149.42+/- Ac 8495855
- 2291 Antioch Rd
- 49 Liberty Hill Rd
- 69 Liberty Hill Rd
- 135 Liberty Hill Rd
- 189 Liberty Hill Rd
- 2577 Antioch Rd
- 2577 Antioch Rd
- 2537 Antioch Rd
- 211 Liberty Hill Rd
- 1795 Antioch Rd
- 1054 Antioch Rd
- 1504 Antioch Rd
- 1204 Antioch Rd
Ask me questions while you tour the home.