2191 Carriage Dr Morrow, GA 30260
Estimated Value: $246,000 - $298,000
About This Home
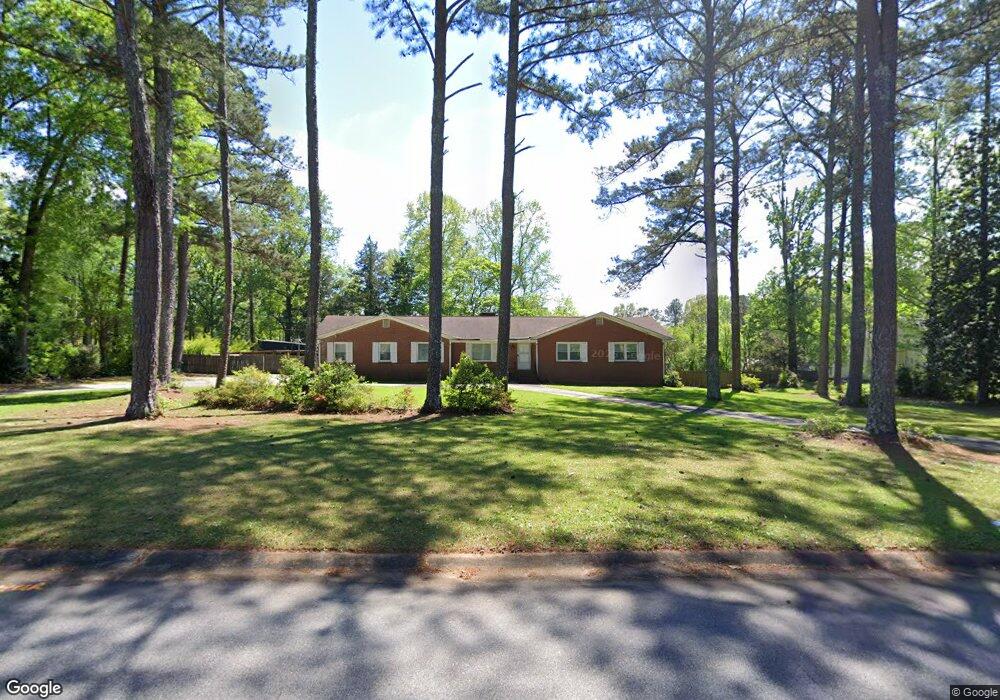
This home is located at 2191 Carriage Dr, Morrow, GA 30260 and is currently estimated at $272,128, approximately $116 per square foot. 2191 Carriage Dr is a home located in Clayton County with nearby schools including William M. Mcgarrah Elementary School, Morrow Middle School, and Morrow High School.
Ownership History
We collect this data history from publicly available records. To have your information removed, we recommend requesting removal directly through your county’s website.
Purchase Details
Purchase Details
Purchase Details
Purchase Details
Purchase Details
Purchase Details
Home Financials for this Owner
Home Financials are based on the most recent Mortgage that was taken out on this home.Purchase Details
Home Values in the Area
Average Home Value in this Area
Purchase History
We collect this data history from publicly available records. To have your information removed, we recommend requesting removal directly through your county’s website.
| Date | Buyer | Sale Price | Title Company |
|---|---|---|---|
| -- | -- | ||
| -- | -- | ||
| -- | -- | ||
| $64,000 | -- | ||
| -- | -- | ||
| $129,617 | -- | ||
| $184,000 | -- | ||
| -- | -- | ||
| -- | -- |
Mortgage History
We collect this data history from publicly available records. To have your information removed, we recommend requesting removal directly through your county’s website.
| Date | Status | Borrower | Loan Amount |
|---|---|---|---|
| Previous Owner | $174,800 |
Tax History
We collect this data history from publicly available records. To have your information removed, we recommend requesting removal directly through your county’s website.
| Year | Tax Paid | Tax Assessment Tax Assessment Total Assessment is a certain percentage of the fair market value that is determined by local assessors to be the total taxable value of land and additions on the property. | Land | Improvement |
|---|---|---|---|---|
| 2025 | $1,498 | $87,600 | $10,400 | $77,200 |
| 2024 | $1,581 | $89,000 | $10,400 | $78,600 |
| 2023 | $2,397 | $66,400 | $10,400 | $56,000 |
| 2022 | $1,100 | $64,720 | $10,400 | $54,320 |
| 2021 | $1,119 | $64,960 | $10,400 | $54,560 |
| 2020 | $2,573 | $63,149 | $10,400 | $52,749 |
| 2019 | $2,120 | $61,052 | $11,200 | $49,852 |
| 2018 | $1,914 | $55,985 | $11,200 | $44,785 |
| 2017 | $1,629 | $48,871 | $11,200 | $37,671 |
| 2016 | $1,710 | $50,861 | $11,200 | $39,661 |
| 2015 | $1,707 | $0 | $0 | $0 |
| 2014 | $1,665 | $50,658 | $11,200 | $39,458 |
Map
- 0 Carriage Dr Unit 10652198
- 0 Carriage Dr Unit 7688037
- 2144 Carriage Dr
- 0 Maddox Rd Unit 10674000
- 6070 Danbury Ct
- 2379 Prestige Square
- 6092 Prestige Valley Rd
- 6203 Castlewood Dr
- 1926 Old Rex Morrow Rd
- 0 Thompson Blvd
- 2276 Santa fe St Unit 19
- 2316 Santa fe St Unit 5
- 1924 Mural Cir
- 6216 Fieldcrest Dr
- 1902 Mural Cir Unit 5
- 6359 Lanier Rd
- 6205 Fieldcrest Dr
- 2275 Santa fe St Unit 25
- 2117 Amish Ct
- 6364 Maddox Rd
- 2167 Carriage Dr
- 2211 Carriage Dr
- 2182 Marion Ln
- 2200 Marion Ln
- 2196 Carriage Dr
- 2178 Carriage Dr
- 2151 Carriage Dr Unit 8
- 2151 Carriage Dr
- 2216 Carriage Dr
- 2164 Carriage Dr
- 2170 Marion Ln
- 2218 Marion Ln
- 2191 Carmen Ct
- 2231 Carriage Dr
- 2149 Old Rex Morrow Rd
- 2201 Carmen Ct
- 2204 Harbin Terrace Dr
- 2181 Carmen Ct
- 2212 Harbin Terrace Dr Unit 81
- 2212 Harbin Terrace Dr
Ask me questions while you tour the home.