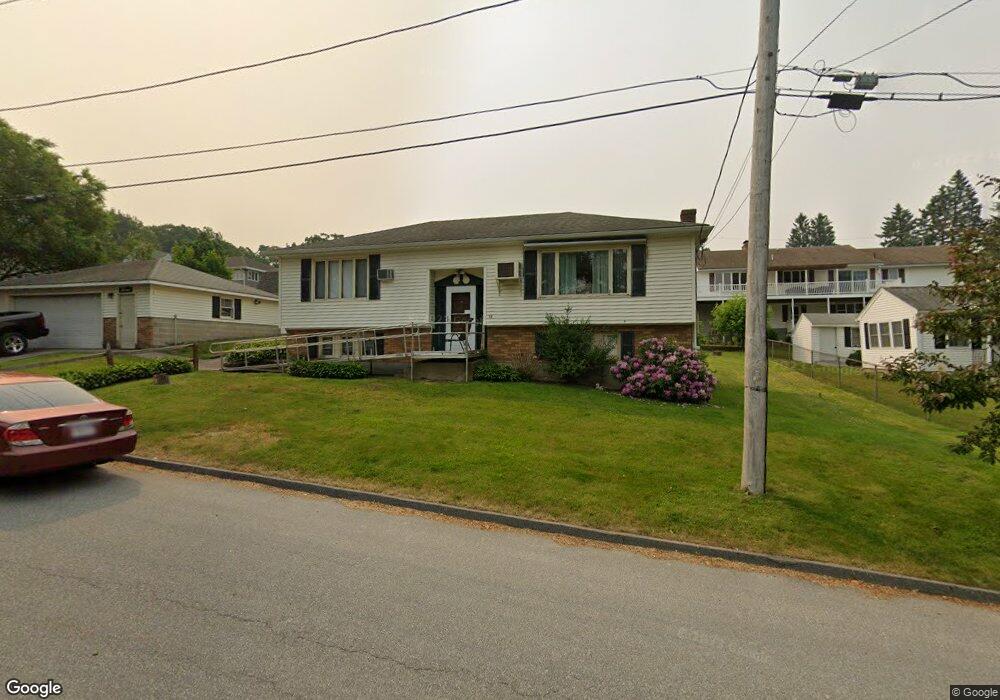
22 Benson St Worcester, MA 01604
Broadmeadow Brook NeighborhoodEstimated Value: $405,000 - $528,000
2
Beds
2
Baths
1,128
Sq Ft
$396/Sq Ft
Est. Value
About This Home
This home is located at 22 Benson St, Worcester, MA 01604 and is currently estimated at $446,247, approximately $395 per square foot. 22 Benson St is a home located in Worcester County with nearby schools including Jacob Hiatt Magnet School, Chandler Magnet, and Rice Square Elementary School.
Ownership History
Date
Name
Owned For
Owner Type
Purchase Details
Closed on
Jul 15, 2024
Sold by
Ferraro Margaret C
Bought by
Margaret C Ferraro Ret and Ferraro
Current Estimated Value
Purchase Details
Closed on
Sep 20, 1991
Sold by
Baril Theodore P and Baril Gloria
Bought by
Ferraro Anthony L and Ferraro Margaret
Create a Home Valuation Report for This Property
The Home Valuation Report is an in-depth analysis detailing your home's value as well as a comparison with similar homes in the area
Home Values in the Area
Average Home Value in this Area
Purchase History
We collect this data history from publicly available records. To have your information removed, we recommend requesting removal directly through your county’s website.
| Date | Buyer | Sale Price | Title Company |
|---|---|---|---|
| Margaret C Ferraro Ret | -- | None Available | |
| Margaret C Ferraro Ret | -- | None Available | |
| Ferraro Anthony L | $130,000 | -- | |
| Ferraro Anthony L | $130,000 | -- |
Source: Public Records
Mortgage History
We collect this data history from publicly available records. To have your information removed, we recommend requesting removal directly through your county’s website.
| Date | Status | Borrower | Loan Amount |
|---|---|---|---|
| Previous Owner | Ferraro Anthony L | $25,000 |
Source: Public Records
Tax History
| Year | Tax Paid | Tax Assessment Tax Assessment Total Assessment is a certain percentage of the fair market value that is determined by local assessors to be the total taxable value of land and additions on the property. | Land | Improvement |
|---|---|---|---|---|
| 2025 | $4,926 | $373,500 | $118,700 | $254,800 |
| 2024 | $4,839 | $351,900 | $118,700 | $233,200 |
| 2023 | $4,711 | $328,500 | $103,200 | $225,300 |
| 2022 | $4,131 | $271,600 | $82,600 | $189,000 |
| 2021 | $3,985 | $244,800 | $66,100 | $178,700 |
| 2020 | $3,925 | $230,900 | $66,100 | $164,800 |
| 2019 | $3,850 | $213,900 | $59,500 | $154,400 |
| 2018 | $3,901 | $206,300 | $59,500 | $146,800 |
| 2017 | $3,775 | $196,400 | $59,500 | $136,900 |
| 2016 | $3,702 | $179,600 | $43,700 | $135,900 |
| 2015 | $3,275 | $163,200 | $43,700 | $119,500 |
| 2014 | $3,189 | $163,200 | $43,700 | $119,500 |
Source: Public Records
Map
Nearby Homes
- 76 Valmor St
- 15 Primrose St
- 259 Massasoit Rd
- 20 Lamar Ave
- 12 Lamar Ave
- 1 Brightwood Ave
- 201 Dana Ave
- 5 Phoenix St
- 133 Puritan Ave
- 34 Marjorie St
- 143 Dorcester
- 37 Dupuis Ave
- 2 Woodcliffe Ave
- 31 Blithewood Ave Unit 701
- 31 Blithewood Ave Unit 1201
- 42 Ernest Ave
- 14 Orton St
- 64 Park Terrace Rd
- 63 Park Terrace Rd
- 135 Cohasset St
Your Personal Tour Guide
Ask me questions while you tour the home.