22 Dennis St Springfield, MA 01118
East Forest Park NeighborhoodEstimated Value: $244,000 - $291,000
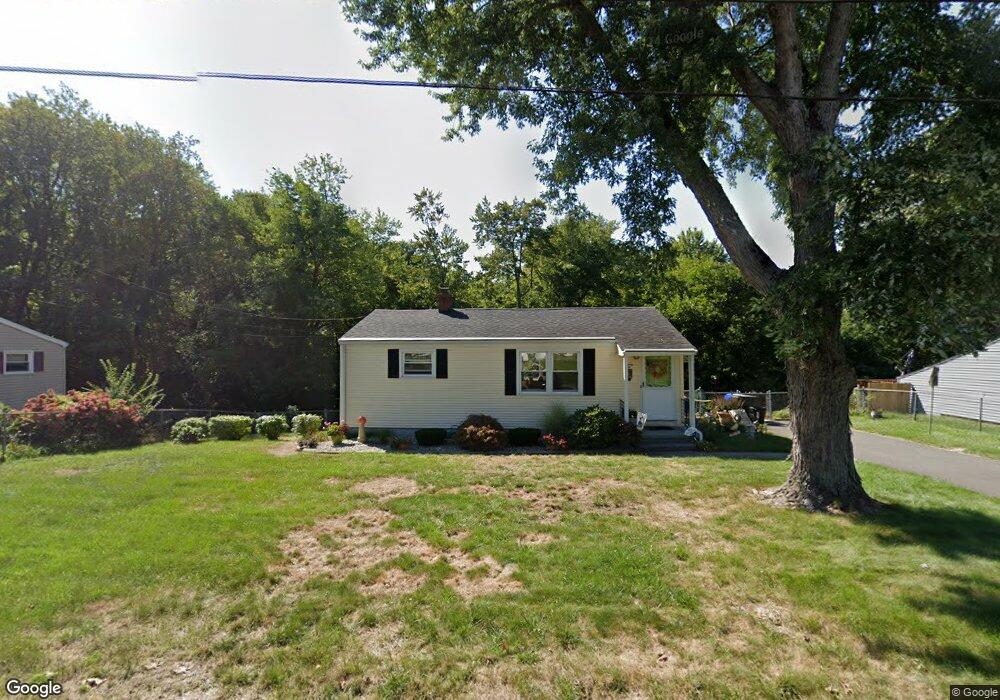
About This Home
This home is located at 22 Dennis St, Springfield, MA 01118 and is currently estimated at $267,318, approximately $327 per square foot. 22 Dennis St is a home located in Hampden County with nearby schools including Frederick Harris Elementary School, M Marcus Kiley Middle, and Springfield High School of Science and Technology.
Ownership History
We collect this data history from publicly available records. To have your information removed, we recommend requesting removal directly through your county’s website.
Purchase Details
Home Financials for this Owner
Home Financials are based on the most recent Mortgage that was taken out on this home.Home Values in the Area
Average Home Value in this Area
Purchase History
We collect this data history from publicly available records. To have your information removed, we recommend requesting removal directly through your county’s website.
| Date | Buyer | Sale Price | Title Company |
|---|---|---|---|
| $87,000 | -- |
Mortgage History
We collect this data history from publicly available records. To have your information removed, we recommend requesting removal directly through your county’s website.
| Date | Status | Borrower | Loan Amount |
|---|---|---|---|
| Closed | $46,500 | ||
| Closed | $47,000 |
Tax History
We collect this data history from publicly available records. To have your information removed, we recommend requesting removal directly through your county’s website.
| Year | Tax Paid | Tax Assessment Tax Assessment Total Assessment is a certain percentage of the fair market value that is determined by local assessors to be the total taxable value of land and additions on the property. | Land | Improvement |
|---|---|---|---|---|
| 2025 | $2,860 | $182,400 | $41,900 | $140,500 |
| 2024 | $2,846 | $177,200 | $41,900 | $135,300 |
| 2023 | $2,921 | $171,300 | $43,600 | $127,700 |
| 2022 | $2,657 | $141,200 | $43,600 | $97,600 |
| 2021 | $2,495 | $132,000 | $39,600 | $92,400 |
| 2020 | $2,447 | $125,300 | $39,600 | $85,700 |
| 2019 | $2,466 | $125,300 | $39,600 | $85,700 |
| 2018 | $2,478 | $125,900 | $39,600 | $86,300 |
| 2017 | $2,340 | $119,000 | $39,600 | $79,400 |
| 2016 | $2,039 | $103,700 | $39,600 | $64,100 |
| 2015 | $1,861 | $94,600 | $39,600 | $55,000 |
Map
- 647 Plumtree Rd
- 78 Briarwood Ave
- 235 Chalmers St
- 121 Benz St
- 174 Abbott St
- 29 Hudson St
- 43 Pine Hill Rd
- 55 Allen St
- 210 Winton St
- 87 Bridle Path Rd
- 43 Sunridge Dr
- 915 Bradley Rd
- 49 Canterbury Rd
- 103 Manor Ct Unit 103
- 51 Hartford Terrace
- 42 Amos Dr
- 306 Greenaway Dr
- 378 Roosevelt Ave
- 97 Treetop Ave
- 79 Roosevelt Ave
Ask me questions while you tour the home.